Fig. 3
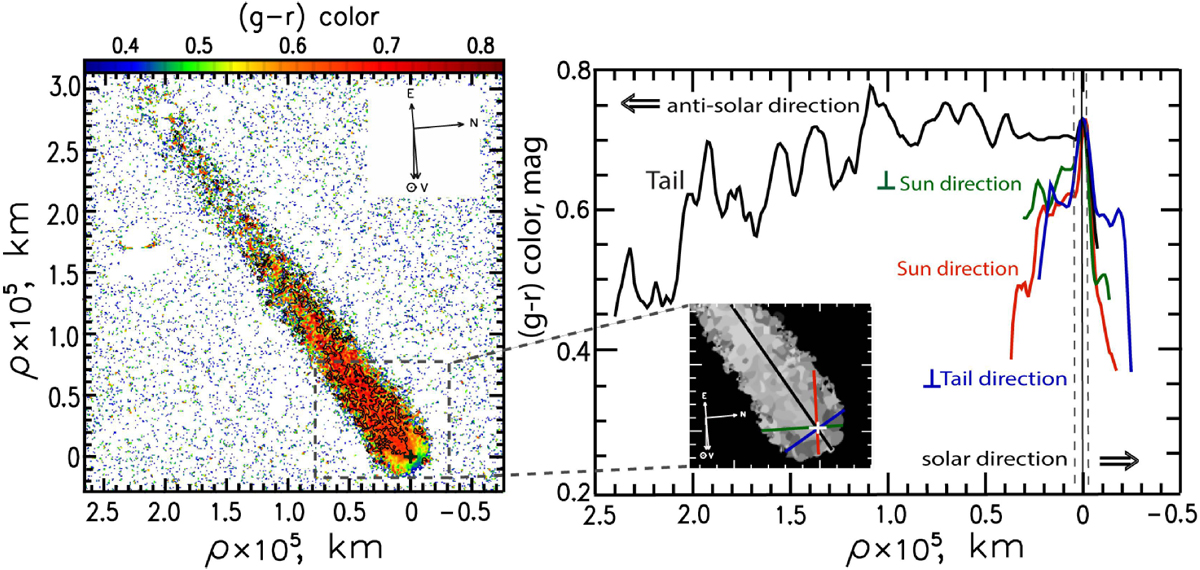
Color map (g–r) of comet C/2014 A4 (SONEAR) derived from the November 5.85, 2015, images in the g-sdss and r-sdss filters (left). The map is color-coded according to the color indexes in magnitudes, as indicated at the top of the left image. The scans across the color map are displayed on the right: along the solar and anti-solar directions; perpendicular to the solar–anti-solar direction, and along and perpendicular to the tail. Positive distance is in the antisolar direction, and negative distance is in the solar direction. The inset shows a larger scale near-nucleus area with the directions of the scans. The vertical dashed lines indicate the spatial extent associated with the seeing. North, east, sunward, and velocity vector directions are indicated.
Current usage metrics show cumulative count of Article Views (full-text article views including HTML views, PDF and ePub downloads, according to the available data) and Abstracts Views on Vision4Press platform.
Data correspond to usage on the plateform after 2015. The current usage metrics is available 48-96 hours after online publication and is updated daily on week days.
Initial download of the metrics may take a while.