| Issue |
A&A
Volume 626, June 2019
|
|
|---|---|---|
| Article Number | A60 | |
| Number of page(s) | 35 | |
| Section | Catalogs and data | |
| DOI | https://doi.org/10.1051/0004-6361/201834363 | |
| Published online | 13 June 2019 | |
F-GAMMA: Multi-frequency radio monitoring of Fermi blazars
The 2.64 to 43 GHz Effelsberg light curves from 2007–2015⋆
1
Max-Planck-Institut für Radioastronomie, Auf dem Hügel 69, 53121 Bonn, Germany
e-mail: eangelakis@mpifr-bonn.mpg.de; agele@physics.auth.gr
2
Fraunhofer Institute for High Frequency Physics and Radar Techniques, Fraunhoferstraße 20, 53343 Wachtberg, Germany
3
Deimos Space UK, Fermi Avenue R103, Harwell, Oxford OX11 0QR, UK
4
Istituto di Astrofisica e Planetologia Spaziali, Via Fosso del Cavaliere 100, 00133 Rome, Italy
5
Department of Astrophysics/IMAPP, Radboud University, PO Box 9010 6500 GL Nijmegen, The Netherlands
6
Max-Planck-Institute for Astrophysics, Karl-Schwarzschild-Str. 1, 85748 Garching, Germany
Received:
2
October
2018
Accepted:
7
December
2018
Context. The advent of the Fermi gamma-ray space telescope with its superb sensitivity, energy range, and unprecedented capability to monitor the entire 4π sky within less than 2–3 h, introduced a new standard in time domain gamma-ray astronomy. Among several breakthroughs, Fermi has – for the first time – made it possible to investigate, with high cadence, the variability of the broadband spectral energy distribution (SED), especially for active galactic nuclei (AGN). This is necessary for understanding the emission and variability mechanisms in such systems. To explore this new avenue of extragalactic physics the Fermi-GST AGN Multi-frequency Monitoring Alliance (F-GAMMA) programme undertook the task of conducting nearly monthly, broadband radio monitoring of selected blazars, which is the dominant population of the extragalactic gamma-ray sky, from January 2007 to January 2015. In this work we release all the multi-frequency light curves from 2.64 to 43 GHz and first order derivative data products after all necessary post-measurement corrections and quality checks.
Aims. Along with the demanding task to provide the radio part of the broadband SED in monthly intervals, the F-GAMMA programme was also driven by a series of well-defined fundamental questions immediately relevant to blazar physics. On the basis of the monthly sampled radio SEDs, the F-GAMMA aimed at quantifying and understanding the possible multiband correlation and multi-frequency radio variability, spectral evolution and the associated emission, absorption and variability mechanisms. The location of the gamma-ray production site and the correspondence of structural evolution to radio variability have been among the fundamental aims of the programme. Finally, the programme sought to explore the characteristics and dynamics of the multi-frequency radio linear and circular polarisation.
Methods. The F-GAMMA ran two main and tightly coordinated observing programmes. The Effelsberg 100 m telescope programme monitoring 2.64, 4.85, 8.35, 10.45, 14.6, 23.05, 32, and 43 GHz, and the IRAM 30 m telescope programme observing at 86.2, 142.3, and 228.9 GHz. The nominal cadence was one month for a total of roughly 60 blazars and targets of opportunity. In a less regular manner the F-GAMMA programme also ran an occasional monitoring with the APEX 12 m telescope at 345 GHz. We only present the Effelsberg dataset in this paper. The higher frequencies data are released elsewhere.
Results. The current release includes 155 sources that have been observed at least once by the F-GAMMA programme. That is, the initial sample, the revised sample after the first Fermi release, targets of opportunity, and sources observed in collaboration with a monitoring programme following up on Planck satellite observations. For all these sources we release all the quality-checked Effelsberg multi-frequency light curves. The suite of post-measurement corrections and flagging and a thorough system diagnostic study and error analysis is discussed as an assessment of the data reliability. We also release data products such as flux density moments and spectral indices. The effective cadence after the quality flagging is around one radio SED every 1.3 months. The coherence of each radio SED is around 40 min.
Conclusions. The released dataset includes more than 3 × 10⁴ measurements for some 155 sources over a broad range of frequencies from 2.64 GHz to 43 GHz obtained between 2007 and 2015. The median fractional error at the lowest frequencies (2.64–10.45 GHz) is below 2%. At the highest frequencies (14.6–43 GHz) with limiting factor of the atmospheric conditions, the errors range from 3% to 9%, respectively.
Key words: astronomical databases: miscellaneous / galaxies: active / galaxies: jets / radio continuum: galaxies / quasars: general / BL Lacertae objects: general
Full Tables 7, 9 and 10 are only available at the CDS via anonymous ftp to cdsarc.u-strasbg.fr (130.79.128.5) or via http://cdsarc.u-strasbg.fr/viz-bin/qcat?J/A+A/626/A60
© ESO 2019
1. Introduction
The current work constitutes the release of the first part of the F-GAMMA (Fuhrmann et al. 2016) dataset, which includes the centimetre and subcentimetre light curves obtained with the 100 m Effelsberg radio telescope between 2007 and 2015. The F-GAMMA programme collected a vast amount of monthly monitoring data for more than 100, almost exclusively, Fermi blazars over an unprecedentedly broad radio spectrum down to submillimetre wavelengths. The current release alone contains more than 3 × 10⁴ measurements that have survived quality filtering, and naturally raises the question of what is the motivation for such a massive observational effort on blazars?
Blazars are active galactic nuclei (AGN) with their collimated, relativistic plasma outflow (jet) in close alignment to the line of sight of the observer (a few degrees, Blandford et al. 1978; Blandford & Königl 1979). The relativistic beaming induced by this configuration causes the jet emission to outshine all other components thus making it an ideal probe of the physical conditions and processes in the exotic environments of relativistic jets. These sources exhibit an exceptionally broad spectral energy distribution (SED), which often spans 20 orders of magnitude in frequency or even more (e.g. Giommi et al. 2012), making blazars the dominant high-energy population. In the Fermi-LAT third source catalogue (3FGL; Acero et al. 2015) blazars comprise 60% of the detected sources and more than 90% of the associated sources. The high-energy-peaked component of their characteristic double-peaked SED (e.g. Abdo et al. 2010a) is argued to be the signature of a photon field that is inverse Compton up-scattered by plasma producing its low-energy-peak synchrotron component. Blazars exhibit intense variability at all energies (e.g. Padovani et al. 2017) over timescales from minutes (e.g. Aleksić et al. 2011, inferred doubling time at TeV energies of around 10 minutes) to several months or more (e.g. Fuhrmann et al. 2016). They typically appear significantly polarised (Strittmatter et al. 1972), especially at higher energies (e.g. Angelakis et al. 2016), and their polarisation also undergoes intensive variability not only in terms of fraction but also polarisation plane orientation (e.g. Marscher et al. 2008; Blinov et al. 2015). The blazar phenomenology and the richness of the relevant jet physics becomes even more apparent with their role as complex particle accelerators and, as of recently, even confirmed neutrino emitters (IceCube Collaboration 2018; Padovani et al. 2018) urging the re-evaluation of our understanding of their dominant emission mechanisms.
The F-GAMMA programme was initiated with the scope to provide necessary multi-frequency radio monitoring complementary to the Fermi-LAT (Atwood et al. 2009) monitoring of the gamma-ray sky, and to study certain aspects of relevant radio physics. Among the notable advantages of radio monitoring of blazars is that the radiation in these bands originates almost entirely at the plasma jet and the contamination with other sources of radio emission is insignificant, if any. The uniqueness of the F-GAMMA programme in particular is attributed to four elements: (a) its multi-frequency character, which allows us to follow the evolution and dynamics of the radio SED and link it with underline physical processes; (b) the relatively high cadence observations, which are optimal (in most cases) for a satisfactory sampling of the spectral evolution, and most importantly, which resolves the inevitable degeneracies that stem from merging several evolving elements into one comparatively large telescope beam; (c) its long duration, which allows us to acquire a firm understanding of the source behaviour at different timescales and to collect a large number of spectral evolution events that probe the emission and variability mechanisms; and finally (d) the availability of multi-frequency linear and circular polarisation light curves (Myserlis et al. 2018) which give access to the microphysics of the emitting plasma (Myserlis et al. 2016; Angelakis et al. 2017). Element (c) is particularly important as it allowed us to collect a large sample of events from an otherwise inherently biased sample as we discuss later.
The analysis that has already been carried out for a limited part of the dataset has led to a series of noteworthy findings. An examination of the F-GAMMA dataset with reference to the first Fermi releases (Abdo et al. 2009, 2010b) showed that the detectability in the giga electron volt (GeV) energy range was an increasing function of the variability in the radio regime (Fuhrmann et al. 2016) as found by other studies (e.g. Richards et al. 2011, with observations at 15 GHz). After accounting for the numerous biases affecting a flux-flux correlation analysis we found that radio and gamma-ray emissions are correlated with a significance that increases with radio frequency (Fuhrmann et al. 2016). This finding was interpreted as an indication that the gamma-ray emission is produced very close to (or in the same region as) the millimetre-band emission region. The radio spectral evolution was used to model and quantify the broadband variability mechanism (Angelakis et al. 2012). On the basis of the cross-correlation of radio and gamma-ray light curves of selected cases, we managed to constrain the gamma-ray emission site (Fuhrmann et al. 2014; Karamanavis et al. 2016). We further developed a method that parametrises each outburst separately allowing us to account for different variability mechanisms operating in the same source at different times. This method was then used to quantify the presence of a relativistic jet in narrow-line Seyfert 1 galaxies (Angelakis et al. 2015) and constrain the multi-frequency variability Doppler factors (Liodakis et al. 2017). Finally, assuming the radio variability to be caused primarily by traveling shocks (Angelakis et al. 2012) we constructed a realistic radio jet emission model able to reproduce the linearly and circularly polarised radiation (Myserlis et al. 2018) and quantify the physical conditions and their evolution in those systems (Myserlis et al. 2016; Angelakis et al. 2017).
In the following we present the F-GAMMA dataset from 2.64 to 43 GHz. The higher frequencies datasets will be released in subsequent publications. We begin with a detailed description of the sample that is included in the data release (Sect. 2) and then we give a detailed description of the observations (Sect. 3) and the post-measurement data treatment (Sect. 4). The raw data are presented in Sect. 5 in the form of multi-frequency light curves. Finally, in Sect. 6 we present spectral indices as a higher level data product. The content of this paper is strictly confined to the needs of a data release. Radio astrophysical studies and interpretation of the data will be presented in subsequent publications
2. Source sample
As we discuss in Sect. 2 of Fuhrmann et al. (2016), the F-GAMMA programme was optimised to complement the Fermi blazar monitoring. Specifically, we developed the programme to quantify and understand the broadband blazar variability, localise the gamma-ray emission site, and study the evolution of conditions in the emitting elements. The initial F-GAMMA sample included 62 sources previously detected by the Energetic Gamma Ray Experiment Telescope (EGRET) with flat-spectrum radio quasars (FSRQs) comprising roughly 52% and BL Lacs 37% of the total.
With the release of the First Fermi-LAT Source Catalogue (Abdo et al. 2010b), the sample was revised around mid-2009 to include exclusively LAT-detected sources. The updated sample comprised a total of 65 Fermi sources, 25 of which are already in the first sample. The new sample was chosen on the basis of the observability of the sources from Effelsberg and IRAM observatories, their variability in radio and gamma rays, whether they were monitored by other programmes and several cases of special interest such as narrow-line Seyfert 1 galaxies. The sources were observed with different cadences and priorities depending on all these parameters (cf. Sect. 3). A considerable amount of observing effort was put on targets of opportunity.
As a consequence, the F-GAMMA sample includes: (a) sources that have been observed only for the first 2.5 years until the sample revision, (b) sources that have been observed over the entire duration of the programme (before and after the sample revision), (c) sources that were included after the sample revision, and (d) targets of opportunity that were observed occasionally. In this work we release the data for every source with at least one measurement. The exception to this rule constitutes a sample of TeV sources (Wakely & Horan 2008) and narrow-line Seyfert 1 galaxies (Angelakis et al. 2015) that will be published in separate papers. Table A.1 lists all the sources in our data release and includes five sections: (a) the main monitored sample that was finalised with the mid-2009 revision, (b) sources monitored until that revision (labelled “old”); (c) sources observed within the F-GAMMA-Planck satellite MoU; (d) other sources observed mostly as targets of opportunity; and (e) calibrators. The sample in section (c) was the result of the partial overlap of the F-GAMMA monitoring and the regular sky-scans of ESA’s Planck satellite1. The source sample and science goals are discussed by Rachen et al. (2016). Part of the dataset is also presented elsewhere (Planck Collaboration XIV 2011; Planck Collaboration XV 2011; Giommi et al. 2012).
Given the primary aim of the programme to understand mechanisms and not population statistics, the F-GAMMA sample has been inevitably biased towards the brightest and most variable blazars; the former guarantee the highest quality datasets and the latter frequent outbursting events. Figure 1 provides a qualitative impression of how our monitored sample is representative of the entire blazar population. There we show the distributions of the energy flux in the range 100 MeV–100 GeV (upper panel) and the variability index (lower panel), respectively, for all the sources in the 3FGL catalogue (Acero et al. 2015) designated as “fsrq”, “bll’,’ and “bcu”. These plots show that the F-GAMMA monitored sample populates the upper end of high-energy distribution as well as that of the variability index. In Fig. 2 we compare the redshift distribution of the F-GAMMA monitored sources to that of all BZCAT catalogue sources (Massaro et al. 2015a). A two-sample KS test showed that the distribution F-GAMMA monitored sample over redshift is not qualitatively different from that of all the BZCAT sources (p-value: 0.009). From this we conclude that despite the biases in its selection the F-GAMMA sample is representative of the blazar population at least in terms of source cosmological distribution.
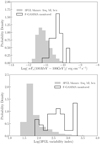 |
Fig. 1. Distribution of energy flux (upper panel) and variability index (lower panel) in the band 100 MeV–100 GeV. The grey area corresponds to all the sources in the 3FGL catalogue designated as “fsrq”, “bll’,’ and “bcu” while the black solid line to the F-GAMMA monitored sample. |
 |
Fig. 2. Redshift distribution for the F-GAMMA monitored sources compared to all the BZCAT sources (Massaro et al. 2015a). |
3. Observations
After the sample revision in mid-2009 the F-GAMMA adopted an optimised observing scheme for the more efficient usage of time. The 35 fastest varying sources, labelled group “f” (Table A.1, Col. 8), were observed on a monthly basis in every session. Another 30 slower variable sources were grouped in two sets of 15 sources each, labelled groups “s1” and “s2’, and were observed every other session. The two groups comprised a total of 65 sources that were being monitored.
The observations were conducted with the secondary focus heterodyne receivers of the 100 m Effelsberg telescope (Table 1). The systems at 4.85, 10.45, and 32 GHz are equipped with multiple feeds allowing differential measurements which partially remove effects of disturbing atmospheric emission or absorption perturbations. Practically, only linear tropospheric disturbances are treated (only partial overlap of the atmosphere columns “seen” by the feeds).
Calibration parameters of the used receivers.
Because the sources are point-like or only slightly extended for the 100 m telescope beam, the observations were conducted with “cross-scans” i.e. by recording the antenna response while repeatedly slewing over the source position in two orthogonal directions. One slew in one direction has been termed a “sub-scan”. In our case the scanning was carried out over the azimuthal (AZI) and the elevation (ELV) directions. This technique offers immediate detection of extended source structure or confusion from field sources and pointing offset corrections. The observing cycle typically included two scans: one for telescope pointing and one as the actual measurement.
4. Data reduction and system diagnostics
For the reconstruction of the true source flux density every observation was subjected to a series of post-measurement corrections. The median fractional effects of these corrections are reported in Table 2. Below we discuss them in order of execution.
Median percentage effect of each post-measurement correction applied to the data for each observing frequency.
4.1. Pointing offset correction
At this first stage the reduction pipeline accounts for the power loss caused by possible differences between the commanded and actual source position. The pointing offset is deduced from the difference between the expected source position and the maximisation of the telescope response. If we approximate the telescope main beam pattern with a Gaussian, and the antenna temperature observed by scanning over a direction “i” is Ti, then that corrected for pointing offset is
where i, j is the scanning direction indices with i: ELV, AZI and j: AZI, ELV, Δpj the pointing offset in j direction, and θ the full width at half maximum (FWHM) at the observing frequency. We note that the offset in the j direction is used for the correction of the measurement in the i direction.
In Fig. 3 we show the pointing offsets at three characteristic frequencies: 4.85 GHz (low), 14.60 GHz (intermediate band), and 32.00 GHz (high band). The black solid line corresponds to the AZI and the grey area to the ELV scan. Table 3 summarises the corresponding pointing parameters. As shown in Table 2 we conclude that this effect is of the order of a few percent at maximum for all the receivers.
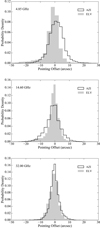 |
Fig. 3. Pointing offsets for scans that have passed basic quality checks. Upper panel: 4.85 GHz (low band), middle band panel: 14.60 GHz (intermediate band), and lower panel: 32.00 GHz (high band). The black solid line corresponds to the longitudinal scan and the grey area to the latitudinal scan. |
Parameters of the Gaussian function fitted in the distributions of pointing offsets for three characteristic frequencies.
4.2. Atmospheric opacity correction
This operation is correcting for the attenuation induced by the signal transmission through the terrestrial atmosphere. The opacity-corrected antenna temperature Topc is computed from the observed antenna temperature T, as
where τatm is the atmospheric opacity at the source ELV.
The opacity τatm at the source position is a function of its ELV, and is given by
where τz is the atmosperic opacity at the zenith and AM the air mass.
Correcting therefore for the atmospheric opacity at the source position requires the knowledge of the opacity at zenith, τz. The zenith opacity is computed from the observed dependence of Tsys on ELV (or equivalently on the airmass AM) and this is done for each individual session. First, a lower envelope (straight line) is fitted to the scatter plot of Tsys against AM. The fitted line is then extrapolated to estimate the system temperature at zero airmass. This point is subsequently connected with the system temperature of the actual measurement to compute the opacity for that scan. In Fig. 4 we plot the computed zenith opacity at three characteristic frequencies.
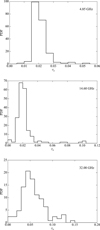 |
Fig. 4. Zenith opacity in three characteristic bands. Upper panel: 4.85 GHz (low band), middle panel: 14.60 GHz (intermediate band), and lower panel: 32.00 GHz (high band). |
The mean opacity at zenith for the receivers used is tabulated in Table 2. As can be seen there, the opacity becomes particularly important towards higher frequencies. Because the opacity correction is that with the largest impact, in Fig. 5 we present its effect at the three typical bands. In those plots we show the fractional increase of the pointing corrected antenna temperature Tpoi when opacity correction is applied.
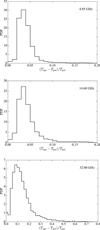 |
Fig. 5. Fractional opacity correction. Upper panel: 4.85 GHz (low band), middle panel: 14.60 GHz (intermediate band), and lower panel: 32.00 GHz (high band). The x-axis is the fractional increase of the antenna temperature corrected for pointing (Tpoi) after the opacity correction has been applied (Topc). |
4.3. Elevation-dependent gain correction
This post-measurement operation accounts for losses caused by small-scale gravity-induced departures of the geometry of the primary reflector from that of an ideal paraboloid. The power loss can be well approximated by a second order polynomial function of the source ELV. For an observed antenna temperature T, the corrected value, is
where G is the “gain curve” value at the observing frequency and at the source ELV. It is given by
In Fig. 6 we show the functions used for our observations. The parameters A0, A1, and A2 are tabulated in Table 1. As shown there, the ELV of maximum gain for the lowest frequencies tends to be at lower elevations. The enhancement of the beam side lobes at these frequencies imposes an overestimation of the opacity at those elevations. Hence, for low elevations the source flux densities tend to be over-corrected. As a result, because the gain curves are computed from opacity-corrected data, they tend to overestimate the gain at those lower elevations. The fractional effect of this operation is constrained to mainly less than one percent (Table 2).
 |
Fig. 6. Gain curve applied at each observing frequency. |
4.4. Absolute calibration
The corrected antenna temperatures are finally converted into Jy by comparison with the observed antenna temperatures of standard targets termed primary calibrators. This operation also corrects for variations in the antenna and receiver gains between different observing epochs. The calibrators used here along with the assumed flux densities are shown in Table 4. In case of multiple calibrator observations a mean correction factor was used. For NGC 7027, our calibration procedure accounts for the temporal evolution of its spectrum (Zijlstra et al. 2008) and a partial power loss is caused by its extended structure relative to the beam size above 10.45 GHz (7″ × 10″, Ott et al. 1994).
Flux densities of the standard calibrators.
4.5. Data editing and final quality check
The previously discussed reduction pipeline provides the end-to-end framework for recovering the real source flux densities from the observables. In practise, each individual sub-scan of each pointing (scan) was examined and quality checked manually by a human. The quality check protocol included various diagnostic tests at various stages of the data reduction pipeline.
Sub-scans. Each sub-scan was inspected for (a) FWHM significantly different from that expected; this could indicate source structure, field source confusion, or variable atmospheric conditions; (b) excessively large pointing offset, which could lead to irreversible power loss. (c) extraordinarily high atmospheric absorption or emission, which could cause destructive increase of noise; (d) large divergence from the mean amplitude of all sub-scans in the scan; (e) excess system temperature; and (f) possible radio frequency interference. The irreversibly corrupted sub-scans were vetoed from further analysis.
Sensitivity. Highest quality observations of calibrators are clearly necessary at this stage. With human supervision this step was executed repeatedly until sensible estimates of the Jy-to-K factors were computed. This step required special care as attenuators could be activated even in the same observing session.
These quality checks were eventually followed by the ultimate test, which included two steps. First, we checked the shape of the radio SED in which every finally reduced frequency was compared against all other observing frequencies with the requirement that the line resemble a physically sensible shape. Second, we tested whether the finally reduced radio SEDs were following physically sensible evolution (mostly smooth).
4.6. Error budget
The end product of the data reduction pipeline is flux densities and their associated uncertainties, which are computed following a modified formal error propagation recipe assuming Gaussian behaviour. For the computation of the uncertainty ei of a flux density measurement Si the information of the entire light curve is used as follows:
where σ0 is the flux density independent term, m flux dependent term proportionality coefficient, and S source mean flux density.
The term σ0, is defined as
where σ is the standard deviation of the flux densities over the mean flux density for the corresponding observing session; and e the error in the mean flux density, assuming Gaussian statistics and after propagating the error of each correction described in Sect. 4.
The term m is a measure of the flux-density-dependent part of the error. It is computed from the scatter of the flux density of each one of the calibrators which is assumed to be invariant, at least over timescales comparable to the length of the data trains discussed in this work2. The proportionality coefficient m henceforth can be seen as a measure of the “repeatability” of the system and has incorporated cumulatively all the sources of errors. In Table 5 we present the mean values of σ0 and m used for each receiver. A physical interpretation of both σ0 and m can be found in Angelakis et al. (2009). In Fig. 7 we show the distribution of the fractional error in three characteristic bands while in Table 6 we list the median fractional errors for all our receivers calculated from all the measurements released here.
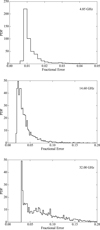 |
Fig. 7. Distribution of fractional error in three characteristic bands. Upper panel: 4.85 GHz (low band), middle panel: 14.60 GHz (intermediate band), and lower panel: 32.00 GHz (high band). |
Average parameters σ0 and m of the error recipe for the different receivers.
Median measurement uncertainties for different frequencies.
4.7. Noise normality
Throughout the preceding discussion we assumed that the noise, inevitably present in our data, behaves normally. This assumption provided the basis for a straightforward approach in the computation of the reported uncertainties in the raw and derivative quantities. We test the hypothesis and show that indeed the noise behaves in a Gaussian manner.
The normality test was run on each individual sub-scan (Sect. 3) of one representative (in terms of tropospheric conditions) observing session. That amounts a total of several hundred datasets. In Fig. 8 we first show the quantile–quantile (Q–Q) probability plot at the three characteristic receivers for a visual inspection of the normality. Each dataset is first shifted to its average (hence it centres at zero) and is having its standard deviation normalised to unity. These transformations allow us to compare the Q–Q plots of all the different datasets and make the interpretation of the Q–Q plots easier. An ideal dataset of a perfectly normal distribution would be described by the y = x line, which in Fig. 8 is plotted as a black solid line. Each one of the blue and red lines comprises the Q–Q plot of one dataset. The red and blue lines correspond to the brightest and weakest sources, respectively, crudely classified by comparison to the median of all datasets.
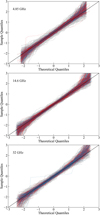 |
Fig. 8. Quantile–quantile (Q-Q) probability plots in three characteristic bands. Upper panel: 4.85 GHz (low band), middle panel: 14.60 GHz (intermediate band), and lower panel: 32.00 GHz (high band). |
Evidently, the departure from normality is rather insignificant. For each dataset we create a mock sample from an ideal Gaussian distribution by randomly selecting the same number of data points as those in the observed dataset. These mock Q–Q lines are indicated in grey. Figure 8 makes it immediately clear then that the sampling alone can account for the departure from normality manifested as a spread of the Q–Q plots.
For the quantification of normality we ran a D’Agostino’s K2 test of the hypothesis that the distribution of a given dataset is Gaussian. For a p-value threshold of 0.05 the hypothesis at 4.85 GHz cannot be rejected for more than 94% of the cases. For the same p-value threshold this fraction is 85% at 14.6 GHz and 89% at 32 GHz practically proving the validity of the hypothesis that the noise is Gaussian.
5. Raw data: Multi-frequency light curves
As we discussed in Sect. 2 the purpose of the current work is the release of the Effelsberg 2.64–43 GHz F-GAMMA dataset. For each source the multi frequency light curves are available in Table 7 (available at the CDS). In Table 9 (also at the CDS) we provide median flux densities and basic descriptive characteristics of the light curves.
Example light curve.
For all the sources that have been monitored by the F-GAMMA programme, i.e. tagged as “f”, “s1”, “s2”, “old”, or F-GAMMA-Planck MoU sources (Sect. 3), we also present their light curves in Fig. B.1. The lower panel in each frame shows the evolution of the three-point low  , and mid-band
  spectral indices defined by S ∝ να. The mean data rate3 in these light curves is around 1.3 months at the lower frequencies, 1.7 months at higher frequencies, and 3.6 months at 43 GHz. Because these values refer to post-quality check data products (not to those observed) the departure from the nominal one month cadence is mostly due to data quality filtering.
5.1. Event rates and duty cycle
Our variability analysis, which will be presented in a subsequent publication, showed that for practically all the frequencies our main target group (“f”, “s1”, and “s2” sources, Fig. B.1) display one outbursting event per year. Exceptionally 43 GHZ gives much lower event rates (∼0.8 yr−1) owing to the poor effective sampling. For the most powerful events defined as those with amplitude A > 0.5Amax, where Amax is the amplitude of the most powerful flare, the median rate is about 0.6–0.7 events per year.
Beyond the frequency of event occurrence it is interesting to get a sense of the distribution of duty cycle; i.e. the fraction of observing time that the source is spending in an active state. We quantify this as the fraction of time that the source is at a phase at least half of the peak-to-peak flux density. Clearly this refers to the most luminous events. In Fig. 9 we present the distribution of the duty cycle at three characteristic frequencies. The mean and median of 0.30 and 0.33, respectively, at 4.85 GHz drop at 0.21 and 0.22 at 32 GHz; this is yet another way to show that the activity happens at progressively longer timescales as the frequency decreases.
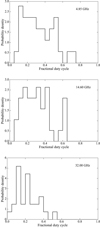 |
Fig. 9. Fractional duty cycle in three characteristic bands. Upper panel: 4.85 GHz (low band), middle panel: 14.60 GHz (intermediate band), lower panel: 32.00 GHz (high band). The bin size is set at 0.05. |
6. Data products: Spectral indices
Table 10 lists median and extreme values of the spectral index distributions of all the sources discussed in Sect. 2 (groups “f”, “s1”, “s2”, “old”, and F-GAMMA-Planck MoU) as well as targets of opportunity for which an adequate dataset was available; in each observation band at least two frequencies were required. It is noted as we discussed earlier that practically each SED was acquired within less that one hour. For the monitored sources the median duration of an SED is between 30 and 40 min implying that they are practically instantaneous and hence free of variability effects. The spectral indices are computed in three bands of progressively higher frequencies: low using 2.64, 4.85 and 8.35 GHz, the middle band over 8.35, 10.4.5, and 14.6 GHz, and in the high band over 14.6, 23.0, 32, and 43 GHz. The spectral index is computed with a least-squares fit of
to the observed flux densities. In each band, observations of at least two frequencies were required for the fit. As a measure of the uncertainty in the computation of spectral indices in Table 10 we also list the median error, σα. In Fig. 10 we show example distributions of the three spectral indices in the characteristic cases of a source that undergoes spectral evolution (upper panel) and one with an achromatically variable SED (lower panel).
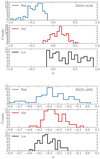 |
Fig. 10. Spectral index distribution in three sub-bands. Upper panel: a source undergoing intense spectral evolution. Lower panel: a source with an almost self-similarly variable SED. |
In Fig. 11 we compare the distributions of the low, mid-, and high sub-band spectral indices for all the sources monitored by F-GAMMA (i.e. groups “f”, “s1”, “s2”, and “old”). We compare separately for minimum, median, and maximum spectral indices. The median â and standard deviation σ of the distributions are also tabulated in Table 8.
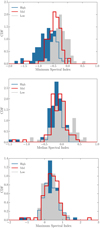 |
Fig. 11. Median (upper panel), minimum (middle panel), and maximum (lower panel) spectral index distribution in three sub-bands. We include sources from the groups “f”, “s1”, “s2”, and “old”. |
Median and standard deviation of the distributions of the median, minimum, and maximum spectral indices in three sub-bands.
Average flux densities and light curve parameters of all observed sources.
Spectral indices for all the sources observed in the F-GAMMA programme computed in three separate sub-bands.
With regard to the minimum spectral indices (upper panel in Fig. 11), the distributions of the three sub-bands are centred at −0.26 (low band), −0.43 (intermediate band), and −0.65 (high band), respectively. A two-sample KS test between any two of the distributions rules out the null hypothesis that they are drawn from the same parent distribution at a level above 4σ. In the case of the median spectral indices (middle panel in Fig. 11), the distinction is less significant but still present. The distributions medians are −0.01 (low band), −0.07 (intermediate band), and −0.14 (high band). A two-sample KS test shows that the low and the high bands are different at the level of 4σ (p-value ∼10−5). The low sub-band median indices seem to be following a bimodal distribution. Normality tests however indicate otherwise. A D’Agostino’s K2 test gave a statistic of 4.2 and a p-value of 0.124 and the Shapiro–Wilk test returned a statistic of 0.97 and a p-value = 0.07 showing that the hypothesis that the distribution is normal cannot be rejected. Finally, for the maximum spectral indices (lower panel in Fig. 11) the separation disappears. The three distributions are instead centred at neighbouring medians of +0.34 (low band), +0.39 (intermediate band), and +0.28 (high band).
This phenomenological discussion makes it already clear that the flat radio spectrum paradigm typically assumed for blazars is only the manifestation of an average behaviour of an otherwise intensely variable SED. The significant difference in the distributions of the low, mid-, and high bands when examining the minimum value that the spectral index, is the mere result of the spectral evolution across our observing bands. Convex spectral components are sequentially appearing in the high band and evolve towards progressively lower frequencies to dissipate as optically thin in the low end of our band. The very negative minimum values of the high-band index (blue distribution) shows that the spectral components evolve across that sub-band. The moderately negative indices in the low band (grey distribution) is caused by the fact that at those energies we observe the blend of several past components that are at different evolutionary stages making up a flat and moderately negative spectrum. Concerning the distributions of the maximum indices in each sub-band, they all populate rather positive values. This is indicative of the fact that the F-GAMMA programme has been successful in monitoring the evolution of events and this was its prime aim.
Concerning the separation of our monitored sources in the two main classes of blazars, namely FSRQs and BL Lacs, none of the distributions appeared significantly different from any other. FSRQs and BL Lacs are thus indistinguishable from one another with respect to their spectral indices. Finally, concerning the GeV energy bands we find that the source parameters are immune to the shape of the radio SED. We specifically searched for dependences of the energy flux, GeV spectral shape, synchrotron component peak frequency, and variability index on the radio spectral index. We only find that there is a marginal indication of a relation between maximum radio spectral index in the low and middle bands and the GeV variability index. For the former case a Spearman’s test gave a ρ ∼ 0.59 with a p-value of 10−4. In the latter case we found that ρ ∼ 0.57 with a p-value of 2 × 10⁻⁴.
To conclude, it is important to emphasise the fact that the dataset presented in this work shows that any sense of spectrum “flatness” is merely the result of intense spectral evolution. This is valid in the most general case where the evolution of several spectral components is ultimately integrated by the observer. It is therefore recommended to depict blazars as systems hosting intense variability in all parameter spaces (time, frequency, and intensity), rather than as simply flat radio spectra.
7. Summary and conclusions
We have presented a dataset that is the result of one among the most comprehensive programmes monitoring Fermi sources in terms of the combination of number of sources observed, frequency coverage, regularity in the sampling, and its cadence. We summarize our findings as follows:
-
The primary scope of the F-GAMMA programme was mostly to provide the necessary multi-frequency radio monitoring complementary to the Fermi-LAT (Atwood et al. 2009) monitoring of the gamma-ray sky and to study all the relevant radio physics. The uniqueness of the programme lies on the combination of its broadband, multi-frequency coverage, the high cadence observations, its long duration, and the availability of multi-frequency linear and circular polarisation light curves (Myserlis et al. 2018).
-
The F-GAMMA monitored sample is undoubtedly biased. Given its primary scope it is made of the brightest and most variable blazars. Still, at least in terms of source cosmological distribution and admixture of the two flavours of blazar AGNs (FSRQs and BLLACs), it is indeed representative of the blazar population.
-
The current release concerns a total of 155 sources, including sources from the initial and the revised monitored sample along with targets of opportunity, primary calibrators, and sources observed within the F-GAMMA-Planck satellite MoU.
-
We release the first part of the F-GAMMA (Fuhrmann et al. 2016) dataset. This includes the light curves obtained with the 100 m Effelsberg radio telescope between 2007 and 2015 at 2.64–43 GHz.
-
Every data point included in this work has been subjected to a suite of post-measurement corrections: pointing, atmospheric opacity, and elevation-dependent gain. The opacity correction is that with the largest impact (up to 26% at the highest frequency) while the other corrections are of no more than a few percent. The entirety of the dataset has been final quality checked. For possible outliers that may still be present, we found no obvious reason why they should be vetoed out of the release. Hence we kept them. The dataset that passed final quality filtering includes a total of 4 × 10⁴ measurements.
-
The reduction, final calibration, and quality checks were carried out on the basis of the principle that each measurement is part of an evolving, broad, radio SED.
-
We validated the assumption, implicit in our analysis and necessary in any parametric statistical method, for the normality of the noise. The hypothesis was investigated using Q-Q plots and quantified with the D’Agostino’s K2 test was passed for more than 85% of the datasets that were tested.
-
Our variability and time series analysis, which will be presented in a forthcoming publication, shows that the median rate for the most powerful events (i.e. with amplitude A > 0.5Amax, with Amax the amplitude of the most powerful flare) is about 0.6–0.7 events per year.
-
Concerning the duty cycle, i.e the fraction of observing time that the source is spending in an active state, we find the median of 0.33 at 4.85 GHz drops to 0.22 at 32 GHz.
-
Our dataset – in any of its possible representations (radio SEDs or light curves) – makes it immediately apparent that the assumption of a flat radio spectrum (especially for blazars) is an oversimplification of an otherwise extremely dynamic system. It is substantially more advisable to refer to systems undergoing extreme spectral evolution the integral of which is what an observer simplistically depicts as a flat spectrum.
The released quality checked light curves provide a unique coverage of the radio part of the SED and are brought to the community for further analyses. The F-GAMMA studies have already been and will be presented elsewhere. A similar data release of the millimeter and sub-mm datasets will follow.
Acknowledgments
Based on observations with the 100 m telescope of the MPIfR (Max-Planck-Institut für Radioastronomie). I.M., I.N. and V.K. were funded by the International Max Planck Research School (IMPRS) for Astronomy and Astrophysics at the Universities of Bonn and Cologne. The authors wish to thank the anonymous journal referee and the internal MPIfR referee Dr J. Liu for a careful reading and constructive comments. The F-GAMMA programme based its ephemeris calculations on numerical routines from the scientific-grade XEphem astronomical software Downey (2011). This research has made use of the NASA/IPAC Extragalactic Database (NED), which is operated by the Jet Propulsion Laboratory, California Institute of Technology, under contract with the National Aeronautics and Space Administration.
References
- Abdo, A. A., Ackermann, M., Ajello, M., et al. 2009, ApJ, 700, 597 [NASA ADS] [CrossRef] [Google Scholar]
- Abdo, A. A., Ackermann, M., Agudo, I., et al. 2010a, ApJ, 716, 30 [NASA ADS] [CrossRef] [Google Scholar]
- Abdo, A. A., Ackermann, M., Ajello, M., et al. 2010b, ApJS, 188, 405 [NASA ADS] [CrossRef] [Google Scholar]
- Acero, F., Ackermann, M., Ajello, M., et al. 2015, ApJS, 218, 23 [Google Scholar]
- Aleksić, J., Antonelli, L. A., Antoranz, P., et al. 2011, ApJ, 730, L8 [NASA ADS] [CrossRef] [Google Scholar]
- Angelakis, E., Kraus, A., Readhead, A. C. S., et al. 2009, A&A, 501, 801 [NASA ADS] [CrossRef] [EDP Sciences] [Google Scholar]
- Angelakis, E., Fuhrmann, L., Nestoras, I., et al. 2012, J. Phys. Conf. Ser., 372 [Google Scholar]
- Angelakis, E., Fuhrmann, L., Marchili, N., et al. 2015, A&A, 575, A55 [NASA ADS] [CrossRef] [EDP Sciences] [Google Scholar]
- Angelakis, E., Hovatta, T., Blinov, D., et al. 2016, MNRAS, 463, 3365 [NASA ADS] [CrossRef] [Google Scholar]
- Angelakis, E., Myserlis, I., & Zensus, J. A. 2017, Galaxies, 5, 81 [NASA ADS] [CrossRef] [Google Scholar]
- Atwood, W. B., Abdo, A. A., Ackermann, M., et al. 2009, ApJ, 697, 1071 [NASA ADS] [CrossRef] [Google Scholar]
- Baars, J. W. M., Genzel, R., Pauliny-Toth, I. I. K., & Witzel, A. 1977, A&A, 61, 99 [NASA ADS] [Google Scholar]
- Berton, M., Foschini, L., Ciroi, S., et al. 2015, A&A, 578, A28 [NASA ADS] [CrossRef] [EDP Sciences] [Google Scholar]
- Blandford, R. D., & Königl, A. 1979, ApJ, 232, 34 [NASA ADS] [CrossRef] [Google Scholar]
- Blandford, R. D., & Rees, M. J. 1978, in BL Lac Objects, ed. A. M. Wolfe, 328 [Google Scholar]
- Blinov, D., Pavlidou, V., Papadakis, I., et al. 2015, MNRAS, 453, 1669 [NASA ADS] [CrossRef] [Google Scholar]
- Cappellari, M., Emsellem, E., Krajnović, D., et al. 2011, MNRAS, 413, 813 [NASA ADS] [CrossRef] [Google Scholar]
- Chiaberge, M., Capetti, A., & Celotti, A. 1999, A&A, 349, 77 [NASA ADS] [Google Scholar]
- de Vries, W. H., O’Dea, C. P., Baum, S. A., et al. 1997, ApJS, 110, 191 [NASA ADS] [CrossRef] [Google Scholar]
- Domínguez, A., Primack, J. R., Rosario, D. J., et al. 2011, MNRAS, 410, 2556 [NASA ADS] [CrossRef] [Google Scholar]
- Downey, E. C. 2011, Astrophysics Source Code Library [record ascl:1112.013] [Google Scholar]
- Farnes, J. S., O’Sullivan, S. P., Corrigan, M. E., & Gaensler, B. M. 2014, ApJ, 795, 63 [NASA ADS] [CrossRef] [Google Scholar]
- Fuhrmann, L., Larsson, S., Chiang, J., et al. 2014, MNRAS, 441, 1899 [NASA ADS] [CrossRef] [Google Scholar]
- Fuhrmann, L., Angelakis, E., Zensus, J. A., et al. 2016, A&A, 596, A45 [NASA ADS] [CrossRef] [EDP Sciences] [Google Scholar]
- Giommi, P., Polenta, G., Lähteenmäki, A., et al. 2012, A&A, 541, A160 [NASA ADS] [CrossRef] [EDP Sciences] [Google Scholar]
- Healey, S. E., Romani, R. W., Taylor, G. B., et al. 2007, ApJS, 171, 61 [NASA ADS] [CrossRef] [Google Scholar]
- Hernán-Caballero, A., & Hatziminaoglou, E. 2011, MNRAS, 414, 500 [NASA ADS] [CrossRef] [Google Scholar]
- Hewett, P. C., & Wild, V. 2010, MNRAS, 405, 2302 [NASA ADS] [Google Scholar]
- Hewitt, A., & Burbidge, G. 1991, ApJS, 75, 297 [NASA ADS] [CrossRef] [Google Scholar]
- Hovatta, T., Pavlidou, V., King, O. G., et al. 2014, MNRAS, 439, 690 [NASA ADS] [CrossRef] [Google Scholar]
- Hughes, P. A., Aller, H. D., & Aller, M. F. 1992, ApJ, 396, 469 [NASA ADS] [CrossRef] [Google Scholar]
- IceCube Collaboration 2018, Science, 361, 147 [NASA ADS] [Google Scholar]
- Johnston, K. J., Fey, A. L., Zacharias, N., et al. 1995, AJ, 110, 880 [NASA ADS] [CrossRef] [Google Scholar]
- Karamanavis, V., Fuhrmann, L., Angelakis, E., et al. 2016, A&A, 590, A48 [NASA ADS] [CrossRef] [EDP Sciences] [Google Scholar]
- Laing, R. A., Riley, J. M., & Longair, M. S. 1983, MNRAS, 204, 151 [Google Scholar]
- Leahy, J. P., & Williams, A. G. 1984, MNRAS, 210, 929 [NASA ADS] [CrossRef] [Google Scholar]
- Liodakis, I., Marchili, N., Angelakis, E., et al. 2017, MNRAS, 466, 4625 [NASA ADS] [CrossRef] [Google Scholar]
- Marscher, A. P., Jorstad, S. G., D’Arcangelo, F. D., et al. 2008, Nature, 452, 966 [NASA ADS] [CrossRef] [PubMed] [Google Scholar]
- Massaro, E., Maselli, A., Leto, C., et al. 2015a, Ap&SS, 357, 75 [NASA ADS] [CrossRef] [Google Scholar]
- Massaro, F., Harris, D. E., Liuzzo, E., et al. 2015b, ApJS, 220, 5 [NASA ADS] [CrossRef] [Google Scholar]
- Meyer, E. T., Fossati, G., Georganopoulos, M., & Lister, M. L. 2011, ApJ, 740, 98 [NASA ADS] [CrossRef] [Google Scholar]
- Miller, N. A., & Owen, F. N. 2001, ApJS, 134, 355 [NASA ADS] [CrossRef] [Google Scholar]
- Mortlock, D. J., Warren, S. J., Venemans, B. P., et al. 2011, Nature, 474, 616 [NASA ADS] [CrossRef] [PubMed] [Google Scholar]
- Myserlis, I., Angelakis, E., Kraus, A., et al. 2016, Galaxies, 4, 58 [NASA ADS] [CrossRef] [Google Scholar]
- Myserlis, I., Angelakis, E., Kraus, A., et al. 2018, A&A, 609, A68 [NASA ADS] [CrossRef] [EDP Sciences] [Google Scholar]
- Neronov, A., Semikoz, D., Taylor, A. M., & Vovk, I. 2015, A&A, 575, A21 [NASA ADS] [CrossRef] [EDP Sciences] [Google Scholar]
- Ott, M., Witzel, A., Quirrenbach, A., et al. 1994, A&A, 284, 331 [NASA ADS] [Google Scholar]
- Owen, F. N., Ledlow, M. J., Morrison, G. E., & Hill, J. M. 1997, ApJ, 488, L15 [NASA ADS] [CrossRef] [Google Scholar]
- Padovani, P., Alexander, D. M., Assef, R. J., et al. 2017, A&A Rev., 25, 2 [NASA ADS] [CrossRef] [Google Scholar]
- Padovani, P., Giommi, P., Resconi, E., et al. 2018, MNRAS, 480, 192 [NASA ADS] [CrossRef] [Google Scholar]
- Pinkney, J., Burns, J. O., Ledlow, M. J., Gómez, P. L., & Hill, J. M. 2000, AJ, 120, 2269 [NASA ADS] [CrossRef] [Google Scholar]
- Planck Collaboration XIV. 2011, A&A, 536, A14 [NASA ADS] [CrossRef] [EDP Sciences] [Google Scholar]
- Planck Collaboration XV. 2011, A&A, 536, A15 [NASA ADS] [CrossRef] [EDP Sciences] [Google Scholar]
- Pursimo, T., Ojha, R., Jauncey, D. L., et al. 2013, ApJ, 767, 14 [NASA ADS] [CrossRef] [Google Scholar]
- Pushkarev, A. B., & Kovalev, Y. Y. 2012, A&A, 544, A34 [NASA ADS] [CrossRef] [EDP Sciences] [Google Scholar]
- Rachen, J. P., Fuhrmann, L., Krichbaum, T., et al. 2016, ArXiv e-prints [arXIv:1603.02144] [Google Scholar]
- Richards, J. L., Max-Moerbeck, W., Pavlidou, V., et al. 2011, ApJS, 194, 29 [NASA ADS] [CrossRef] [Google Scholar]
- Samus, N. N., Kazarovets, E. V., Durlevich, O. V., Kireeva, N. N., & Pastukhova, E. N. 2009, VizieR Online Data Catalog: B/gcvs [Google Scholar]
- Sanchez, D. A., Fegan, S., & Giebels, B. 2013, A&A, 554, A75 [NASA ADS] [CrossRef] [EDP Sciences] [Google Scholar]
- Sowards-Emmerd, D., Romani, R. W., Michelson, P. F., Healey, S. E., & Nolan, P. L. 2005, ApJ, 626, 95 [NASA ADS] [CrossRef] [Google Scholar]
- Strittmatter, P. A., Serkowski, K., Carswell, R., et al. 1972, ApJ, 175, L7 [NASA ADS] [CrossRef] [Google Scholar]
- Vandenbroucke, J., Buehler, R., Ajello, M., et al. 2010, ApJ, 718, L166 [NASA ADS] [CrossRef] [Google Scholar]
- Véron-Cetty, M.-P., & Véron, P. 2006, A&A, 455, 773 [NASA ADS] [CrossRef] [EDP Sciences] [Google Scholar]
- Wagner, S. J., Witzel, A., Heidt, J., et al. 1996, AJ, 111, 2187 [NASA ADS] [CrossRef] [Google Scholar]
- Wakely, S. P., & Horan, D. 2008, Int. Cosmic Ray Conf., 3, 1341 [NASA ADS] [Google Scholar]
- White, R. A., Bliton, M., Bhavsar, S. P., et al. 1999, AJ, 118, 2014 [NASA ADS] [CrossRef] [Google Scholar]
- Xu, J., & Han, J. L. 2014, MNRAS, 442, 3329 [NASA ADS] [CrossRef] [Google Scholar]
- Yang, X.-H., Chen, P.-S., & Huang, Y. 2015, MNRAS, 449, 3191 [NASA ADS] [CrossRef] [Google Scholar]
- Zijlstra, A. A., van Hoof, P. A. M., & Perley, R. A. 2008, ApJ, 681, 1296 [NASA ADS] [CrossRef] [Google Scholar]
Appendix A: Source sample
Table A.1 lists all the sources included in the current data release.
List of sources that have been observed within the F-GAMMA programme.
Appendix B: Multi-frequency light curves
Figure B.1 presents the multi-frequency light curves for the faster variable sources in the F-GAMMA sample. Some of their statistical moments are listed in Table 9. Finally, Table 10 lists median and extreme values of the spectral index distributions of all the sources discussed in Table A.1 for which an adequate dataset was available (in each band, observations at least two frequencies are required).
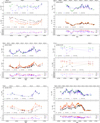 |
Fig. B.1. Multi-frequency light curves for all the sources monitored by the F-GAMMA programme (“f”, “s1”, “s2”, and “old”) and the F-GAMMA-Planck MoU. The lower panel in each frame shows the evolution of the low (2.64, 4.85 and 8.35 GHz), mid-band (8.35, 10.45 and 14.6 GHz), and high-band (14.6, 23.05, 32, 43 GHz) spectral index. Only spectral index estimates from at least three frequencies are shown. Connecting lines have been used to guide the eye. |
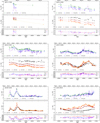 |
Fig. B.1. continued. |
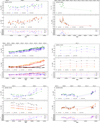 |
Fig. B.1. continued. |
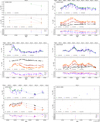 |
Fig. B.1. continued. |
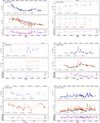 |
Fig. B.1. continued. |
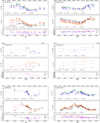 |
Fig. B.1. continued. |
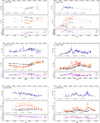 |
Fig. B.1. continued. |
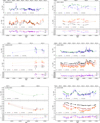 |
Fig. B.1. continued. |
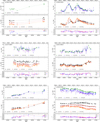 |
Fig. B.1. continued. |
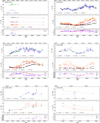 |
Fig. B.1. continued. |
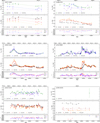 |
Fig. B.1. continued. |
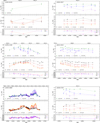 |
Fig. B.1. continued. |
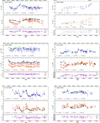 |
Fig. B.1. continued. |
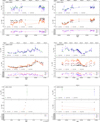 |
Fig. B.1. continued. |
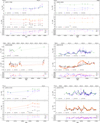 |
Fig. B.1. continued. |
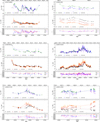 |
Fig. B.1. continued. |
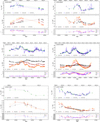 |
Fig. B.1. continued. |
 |
Fig. B.1. continued. |
All Tables
Median percentage effect of each post-measurement correction applied to the data for each observing frequency.
Parameters of the Gaussian function fitted in the distributions of pointing offsets for three characteristic frequencies.
Median and standard deviation of the distributions of the median, minimum, and maximum spectral indices in three sub-bands.
Spectral indices for all the sources observed in the F-GAMMA programme computed in three separate sub-bands.
All Figures
 |
Fig. 1. Distribution of energy flux (upper panel) and variability index (lower panel) in the band 100 MeV–100 GeV. The grey area corresponds to all the sources in the 3FGL catalogue designated as “fsrq”, “bll’,’ and “bcu” while the black solid line to the F-GAMMA monitored sample. |
| In the text | |
 |
Fig. 2. Redshift distribution for the F-GAMMA monitored sources compared to all the BZCAT sources (Massaro et al. 2015a). |
| In the text | |
 |
Fig. 3. Pointing offsets for scans that have passed basic quality checks. Upper panel: 4.85 GHz (low band), middle band panel: 14.60 GHz (intermediate band), and lower panel: 32.00 GHz (high band). The black solid line corresponds to the longitudinal scan and the grey area to the latitudinal scan. |
| In the text | |
 |
Fig. 4. Zenith opacity in three characteristic bands. Upper panel: 4.85 GHz (low band), middle panel: 14.60 GHz (intermediate band), and lower panel: 32.00 GHz (high band). |
| In the text | |
 |
Fig. 5. Fractional opacity correction. Upper panel: 4.85 GHz (low band), middle panel: 14.60 GHz (intermediate band), and lower panel: 32.00 GHz (high band). The x-axis is the fractional increase of the antenna temperature corrected for pointing (Tpoi) after the opacity correction has been applied (Topc). |
| In the text | |
 |
Fig. 6. Gain curve applied at each observing frequency. |
| In the text | |
 |
Fig. 7. Distribution of fractional error in three characteristic bands. Upper panel: 4.85 GHz (low band), middle panel: 14.60 GHz (intermediate band), and lower panel: 32.00 GHz (high band). |
| In the text | |
 |
Fig. 8. Quantile–quantile (Q-Q) probability plots in three characteristic bands. Upper panel: 4.85 GHz (low band), middle panel: 14.60 GHz (intermediate band), and lower panel: 32.00 GHz (high band). |
| In the text | |
 |
Fig. 9. Fractional duty cycle in three characteristic bands. Upper panel: 4.85 GHz (low band), middle panel: 14.60 GHz (intermediate band), lower panel: 32.00 GHz (high band). The bin size is set at 0.05. |
| In the text | |
 |
Fig. 10. Spectral index distribution in three sub-bands. Upper panel: a source undergoing intense spectral evolution. Lower panel: a source with an almost self-similarly variable SED. |
| In the text | |
 |
Fig. 11. Median (upper panel), minimum (middle panel), and maximum (lower panel) spectral index distribution in three sub-bands. We include sources from the groups “f”, “s1”, “s2”, and “old”. |
| In the text | |
 |
Fig. B.1. Multi-frequency light curves for all the sources monitored by the F-GAMMA programme (“f”, “s1”, “s2”, and “old”) and the F-GAMMA-Planck MoU. The lower panel in each frame shows the evolution of the low (2.64, 4.85 and 8.35 GHz), mid-band (8.35, 10.45 and 14.6 GHz), and high-band (14.6, 23.05, 32, 43 GHz) spectral index. Only spectral index estimates from at least three frequencies are shown. Connecting lines have been used to guide the eye. |
| In the text | |
 |
Fig. B.1. continued. |
| In the text | |
 |
Fig. B.1. continued. |
| In the text | |
 |
Fig. B.1. continued. |
| In the text | |
 |
Fig. B.1. continued. |
| In the text | |
 |
Fig. B.1. continued. |
| In the text | |
 |
Fig. B.1. continued. |
| In the text | |
 |
Fig. B.1. continued. |
| In the text | |
 |
Fig. B.1. continued. |
| In the text | |
 |
Fig. B.1. continued. |
| In the text | |
 |
Fig. B.1. continued. |
| In the text | |
 |
Fig. B.1. continued. |
| In the text | |
 |
Fig. B.1. continued. |
| In the text | |
 |
Fig. B.1. continued. |
| In the text | |
 |
Fig. B.1. continued. |
| In the text | |
 |
Fig. B.1. continued. |
| In the text | |
 |
Fig. B.1. continued. |
| In the text | |
 |
Fig. B.1. continued. |
| In the text | |
Current usage metrics show cumulative count of Article Views (full-text article views including HTML views, PDF and ePub downloads, according to the available data) and Abstracts Views on Vision4Press platform.
Data correspond to usage on the plateform after 2015. The current usage metrics is available 48-96 hours after online publication and is updated daily on week days.
Initial download of the metrics may take a while.


