Free Access
Fig. 1.
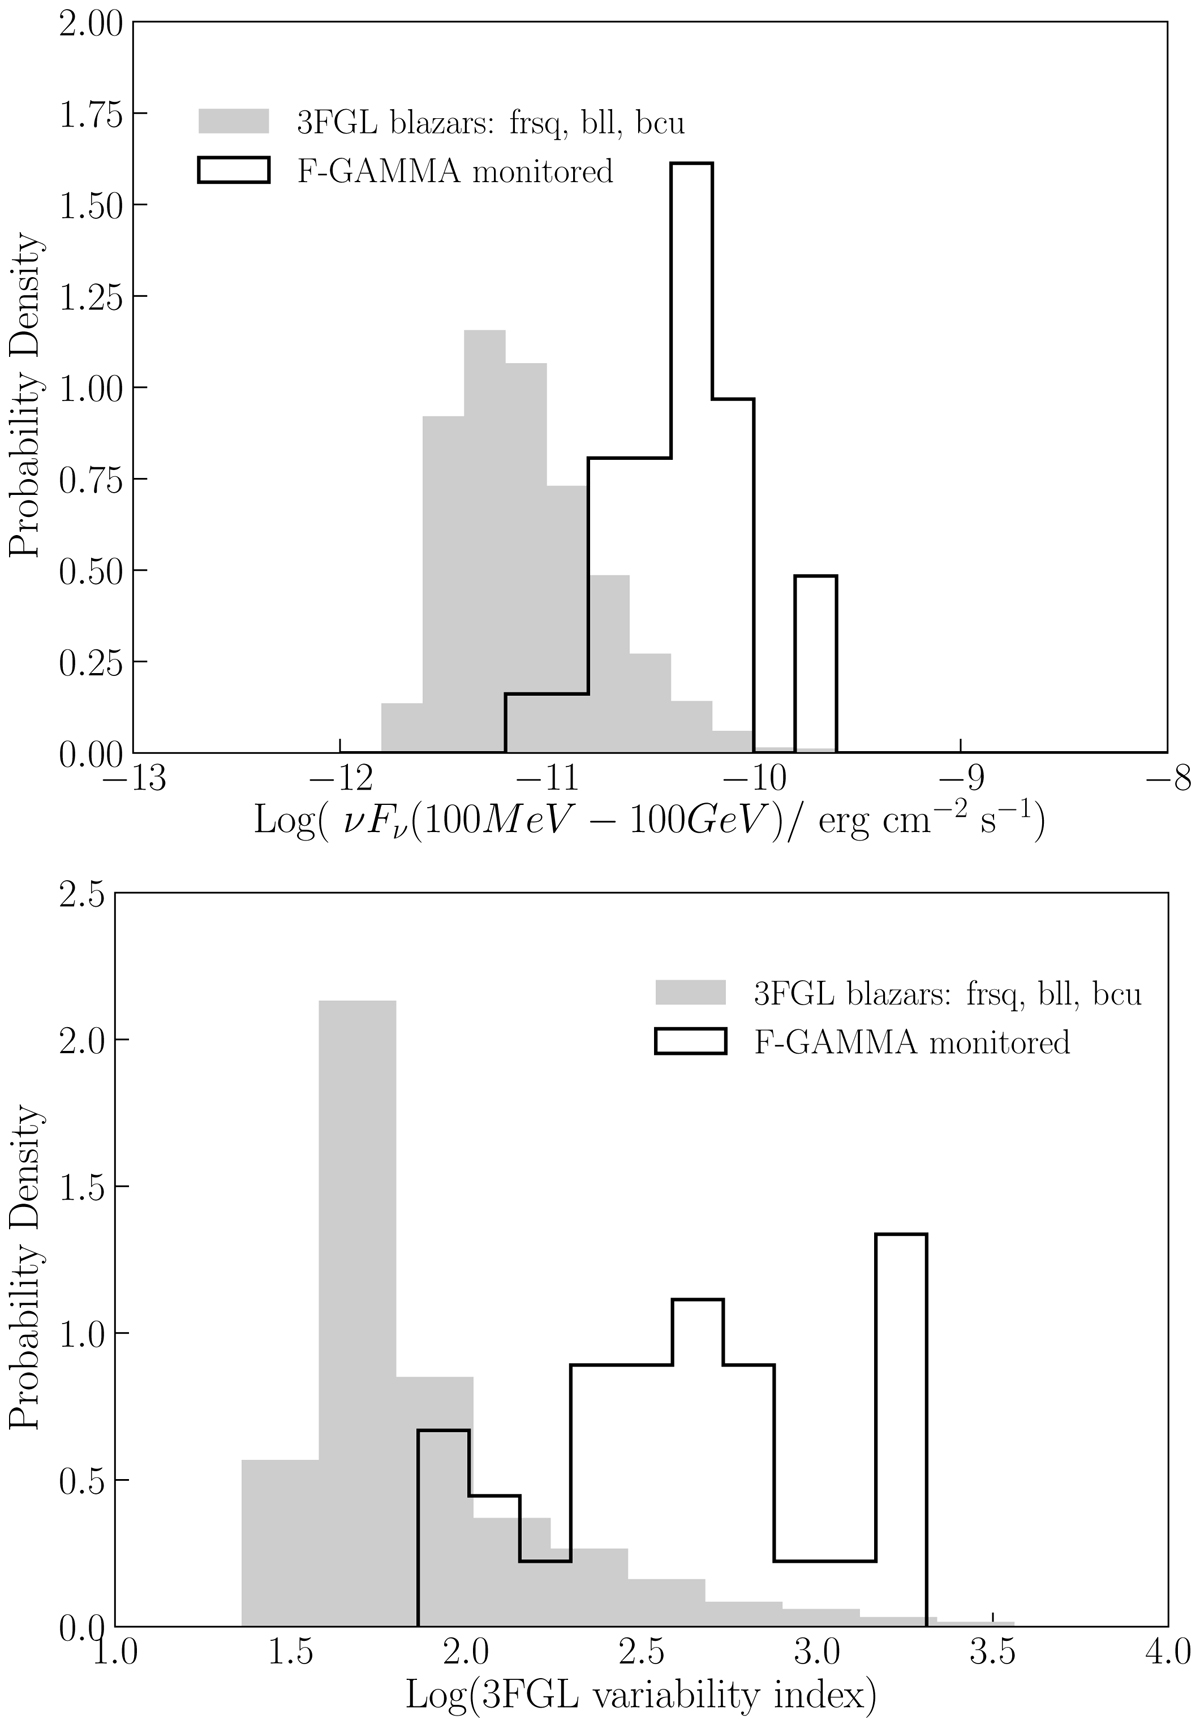
Distribution of energy flux (upper panel) and variability index (lower panel) in the band 100 MeV–100 GeV. The grey area corresponds to all the sources in the 3FGL catalogue designated as “fsrq”, “bll’,’ and “bcu” while the black solid line to the F-GAMMA monitored sample.
Current usage metrics show cumulative count of Article Views (full-text article views including HTML views, PDF and ePub downloads, according to the available data) and Abstracts Views on Vision4Press platform.
Data correspond to usage on the plateform after 2015. The current usage metrics is available 48-96 hours after online publication and is updated daily on week days.
Initial download of the metrics may take a while.