Fig. B.1.
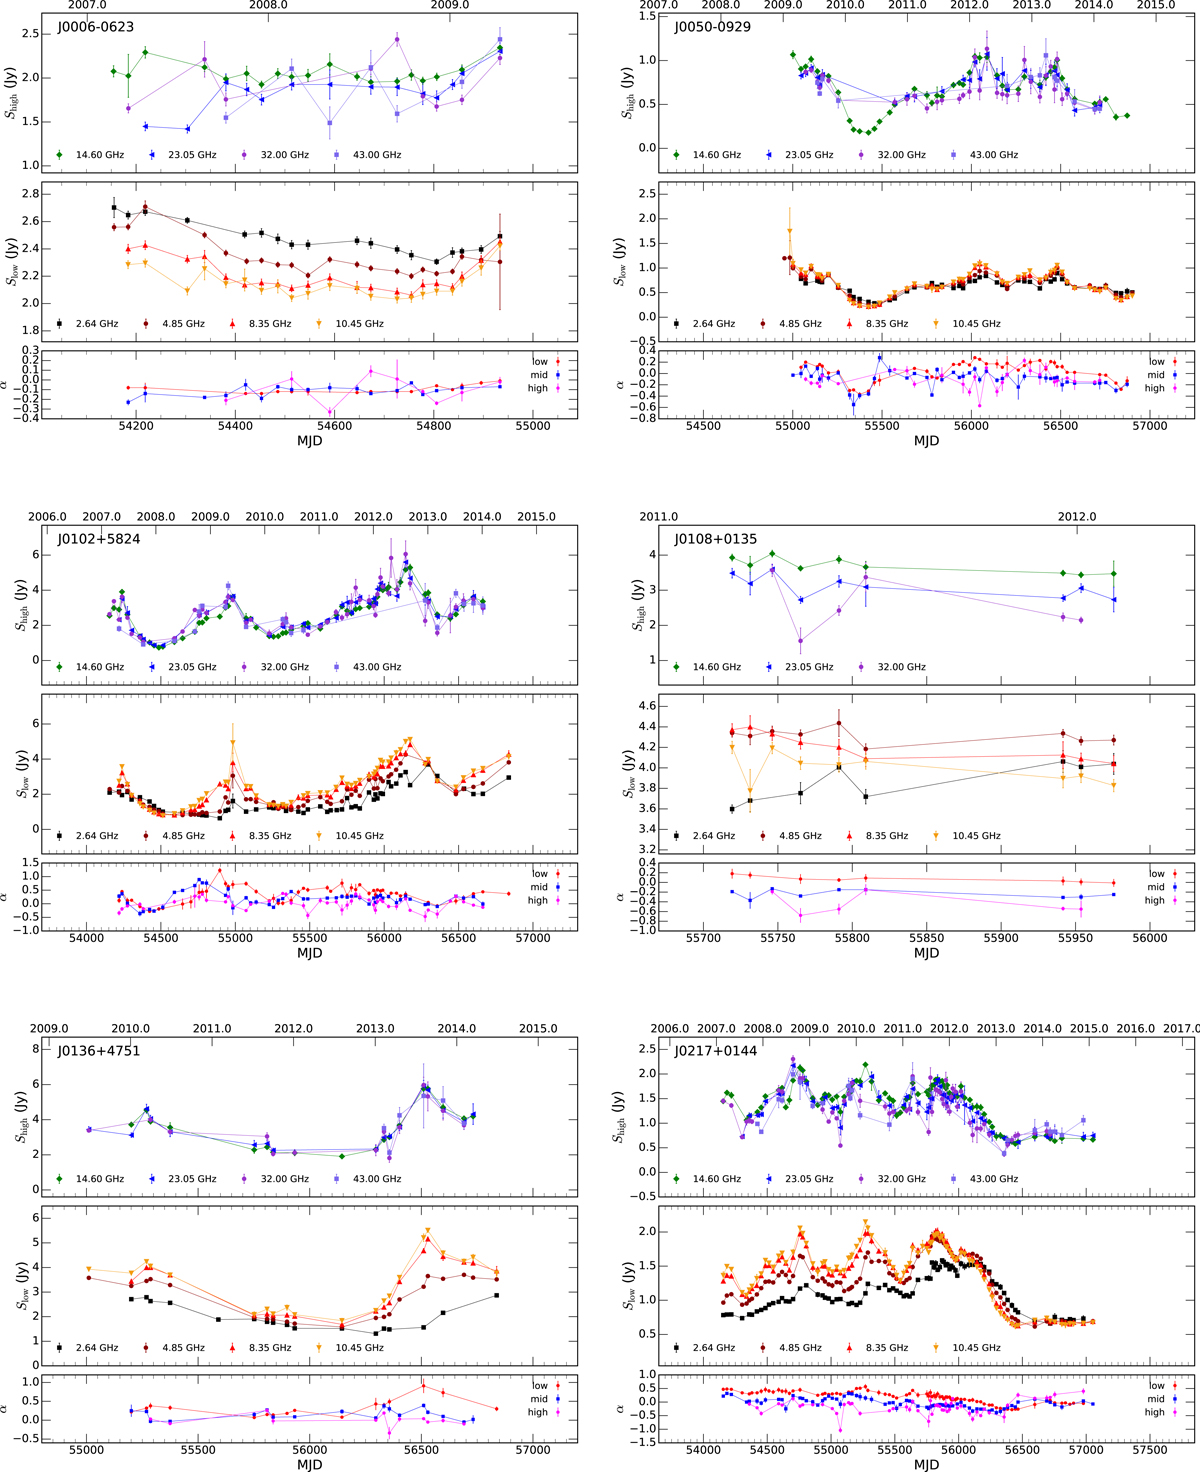
Multi-frequency light curves for all the sources monitored by the F-GAMMA programme (“f”, “s1”, “s2”, and “old”) and the F-GAMMA-Planck MoU. The lower panel in each frame shows the evolution of the low (2.64, 4.85 and 8.35 GHz), mid-band (8.35, 10.45 and 14.6 GHz), and high-band (14.6, 23.05, 32, 43 GHz) spectral index. Only spectral index estimates from at least three frequencies are shown. Connecting lines have been used to guide the eye.
Current usage metrics show cumulative count of Article Views (full-text article views including HTML views, PDF and ePub downloads, according to the available data) and Abstracts Views on Vision4Press platform.
Data correspond to usage on the plateform after 2015. The current usage metrics is available 48-96 hours after online publication and is updated daily on week days.
Initial download of the metrics may take a while.