Fig. 8
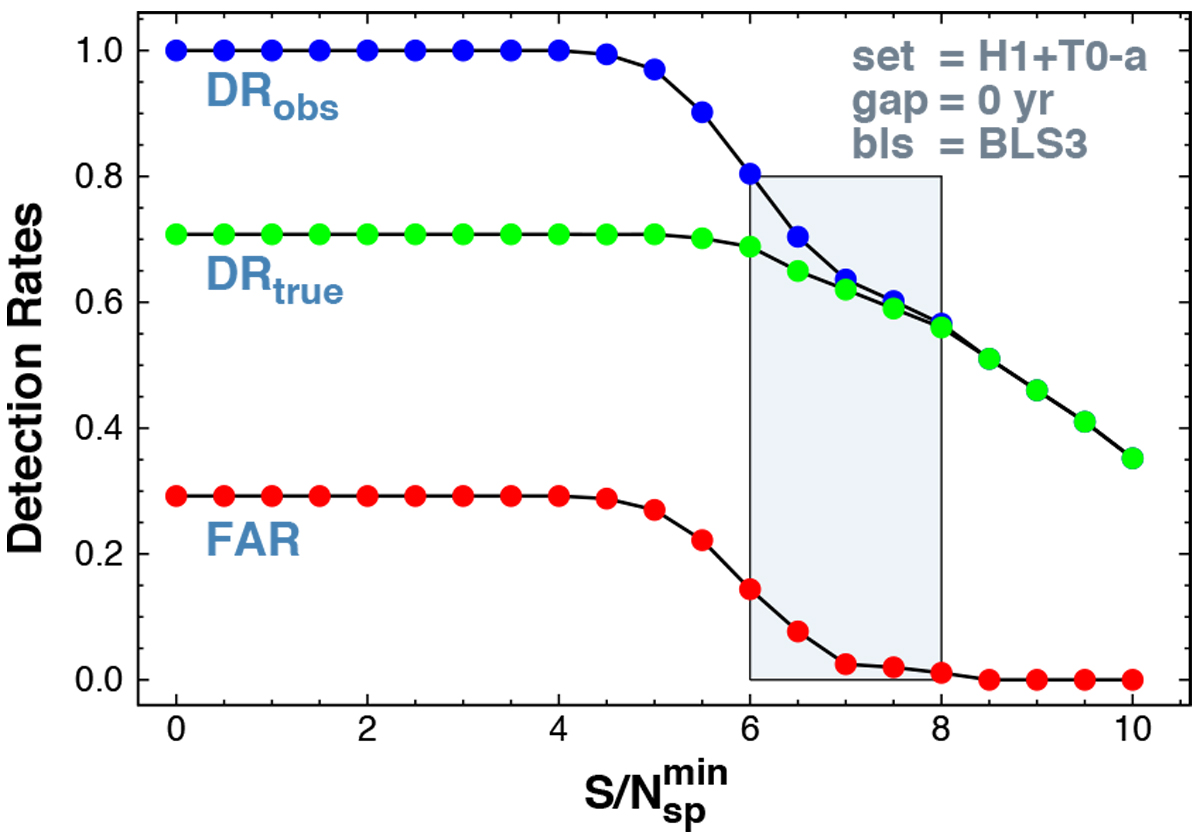
Dependence of the detection rate on the lower limit of the spectrum S/N. The observed rates DRobs are calculated solely on the basis of satisfying the S∕N > S∕Nmin criterion and do not consider the match of the peak frequency to the test frequency. The true detection rate DRtrue results from the correction of the observed rate by the FAR, namely, DRtrue = (1 −FAR) ×DRobs. The signal identification and analysis method are indicated in the upper right corner. The most commonly used range for the lower limit of the spectrum S/N is shown by the gray rectangle. We use 500 random realizations of the signal shown in the header; see also Table 1.
Current usage metrics show cumulative count of Article Views (full-text article views including HTML views, PDF and ePub downloads, according to the available data) and Abstracts Views on Vision4Press platform.
Data correspond to usage on the plateform after 2015. The current usage metrics is available 48-96 hours after online publication and is updated daily on week days.
Initial download of the metrics may take a while.