Fig. 7
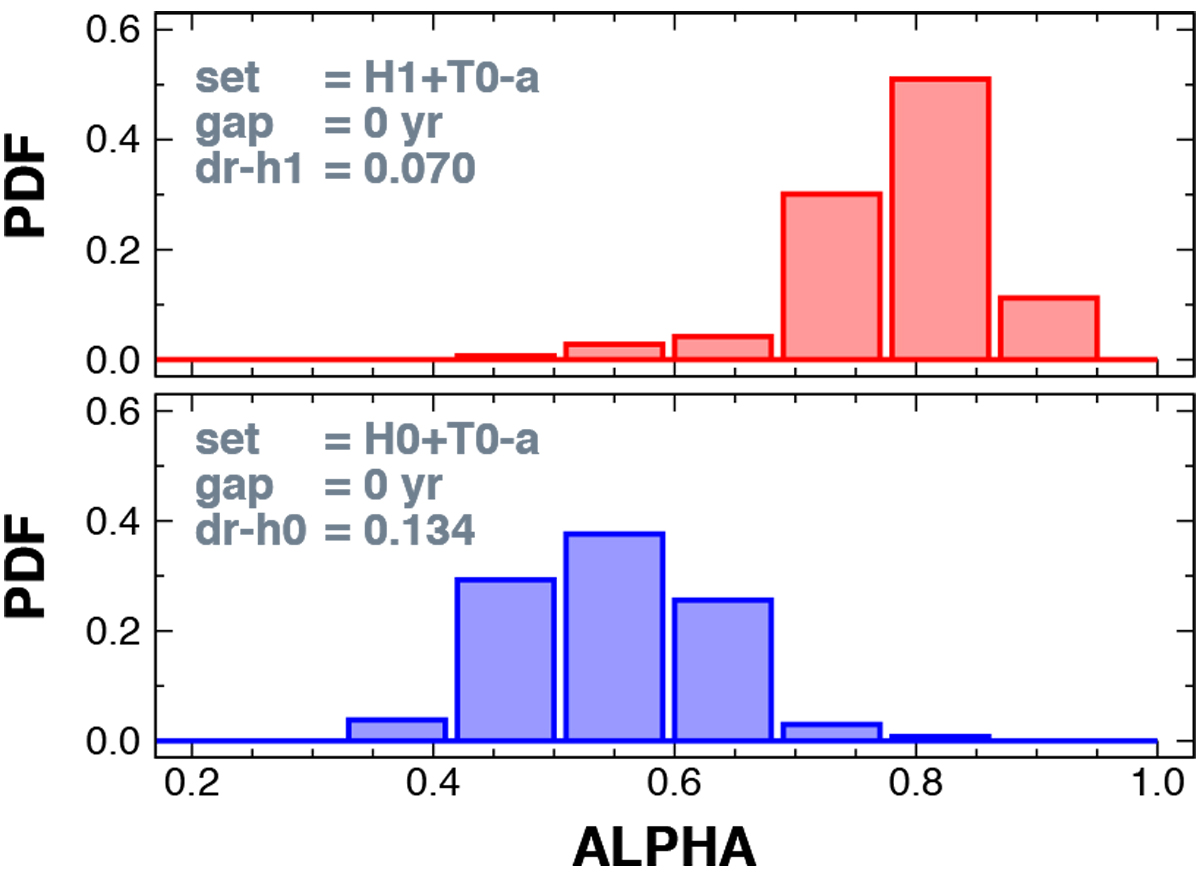
Distribution of the optimum α values from the BLS0 analyses of datasets of different signal detection powers for the secondary sets (see Table 1). The detection ratios obtained from the BLS analyses of the secondary sets alone are given by dr-h0 and dr-h1. All data points used in the construction of the histogram satisfy the detection criteria with S∕Nmin = 6. We use the same 500 realizations in both datasets. Aliasing in set H1 boosts α to higher values for optimized BLS0 performance.
Current usage metrics show cumulative count of Article Views (full-text article views including HTML views, PDF and ePub downloads, according to the available data) and Abstracts Views on Vision4Press platform.
Data correspond to usage on the plateform after 2015. The current usage metrics is available 48-96 hours after online publication and is updated daily on week days.
Initial download of the metrics may take a while.