Fig. 3
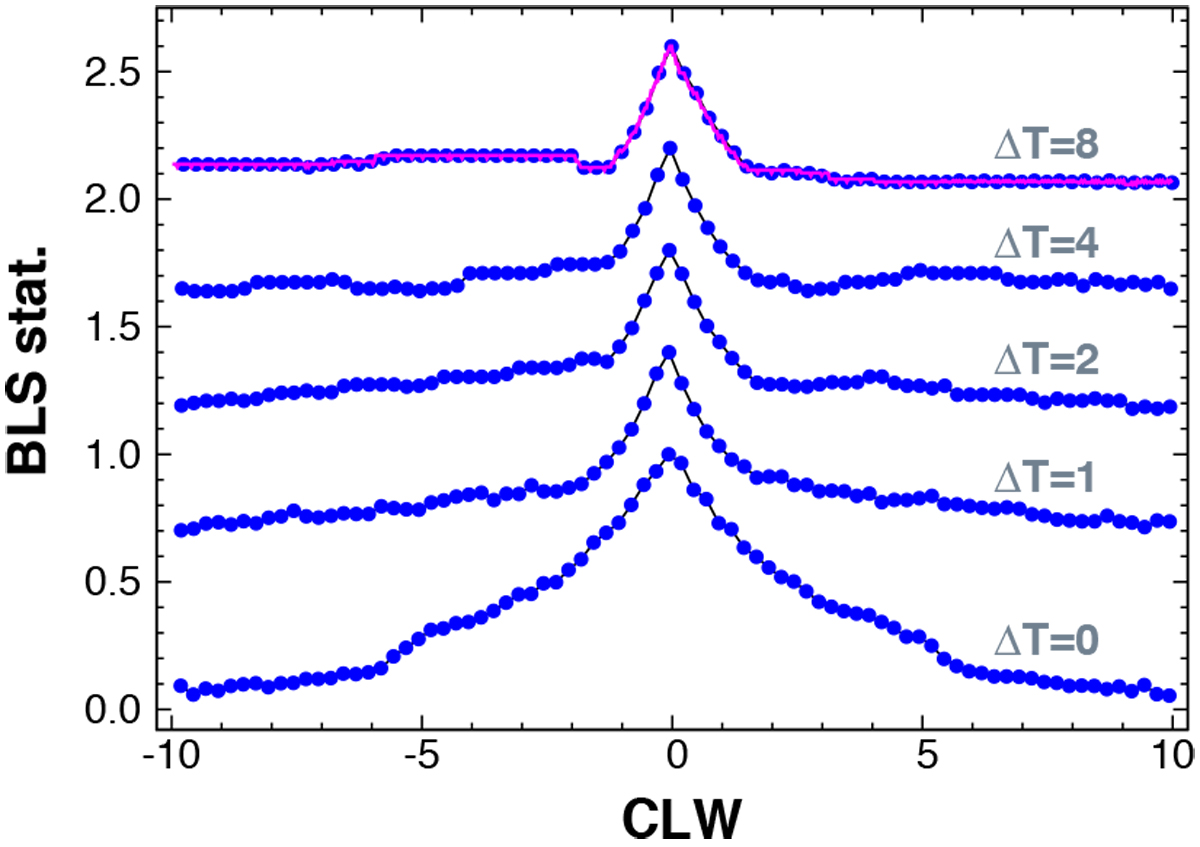
Evolution of the line profile of the BLS frequency spectrum as a function of the gap length (ΔT (yr)) between two sets of time series (H0 and T0 of Table 1). The same signal is used as in Fig. 2. Four samples for each CLW (see text) are used (blue points). For comparison, the densely sampled profile is also shown by the pink continuous line. All profiles are normalized by the peak power and shifted vertically for better visibility. The apparent lift of the profile wings for higher ΔT values is due to the CLW units used on the abscissa.
Current usage metrics show cumulative count of Article Views (full-text article views including HTML views, PDF and ePub downloads, according to the available data) and Abstracts Views on Vision4Press platform.
Data correspond to usage on the plateform after 2015. The current usage metrics is available 48-96 hours after online publication and is updated daily on week days.
Initial download of the metrics may take a while.