Fig. 2
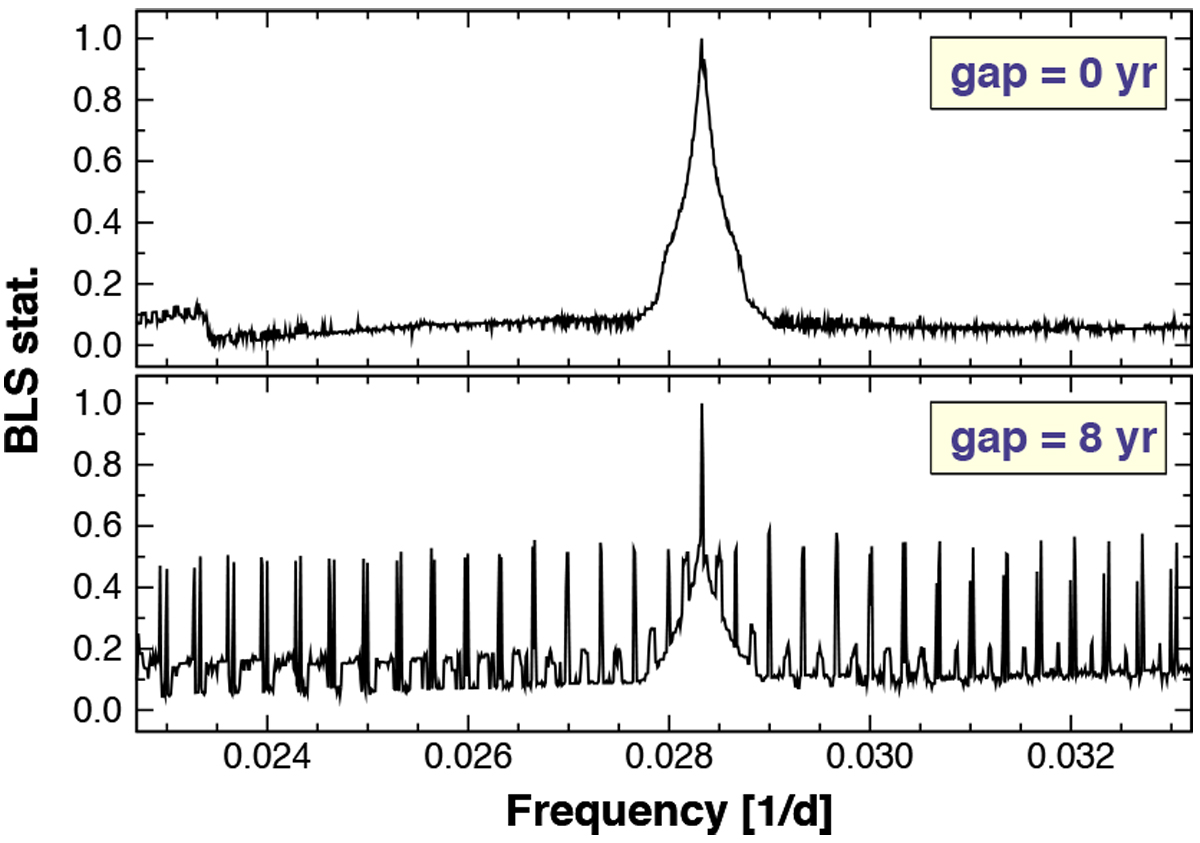
Comparison of the BLS spectra obtained without (upper panel) or with a single 8 yr gap between the ground-based and TESS data. We use the datasets H0 and T0 (emulating the TESS data) of Table 1 with a noiseless signal of P = 35.3 days and a relative transit duration t14∕P = 0.008. Each spectrum is normalized to the respective highest peak.
Current usage metrics show cumulative count of Article Views (full-text article views including HTML views, PDF and ePub downloads, according to the available data) and Abstracts Views on Vision4Press platform.
Data correspond to usage on the plateform after 2015. The current usage metrics is available 48-96 hours after online publication and is updated daily on week days.
Initial download of the metrics may take a while.