Free Access
Fig. 17
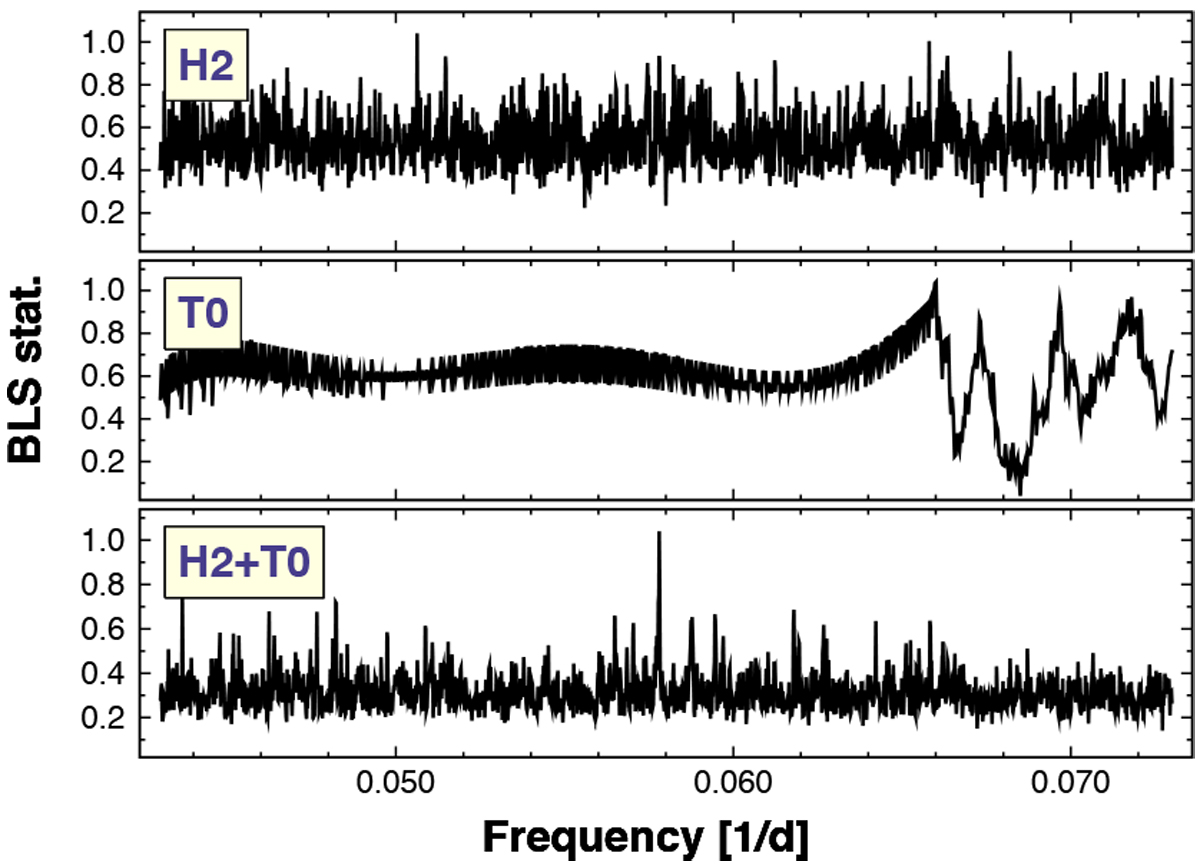
Frequency spectra of the time series shown in Fig. 16. We use α = 0.97 in the computation of the BLS3 spectrum of the combined dataset. The signal is not detected in the “H2 alone” analysis (for T0 the detection is ab initio excluded due to the lack of multiple transit events).
Current usage metrics show cumulative count of Article Views (full-text article views including HTML views, PDF and ePub downloads, according to the available data) and Abstracts Views on Vision4Press platform.
Data correspond to usage on the plateform after 2015. The current usage metrics is available 48-96 hours after online publication and is updated daily on week days.
Initial download of the metrics may take a while.