Fig. 16
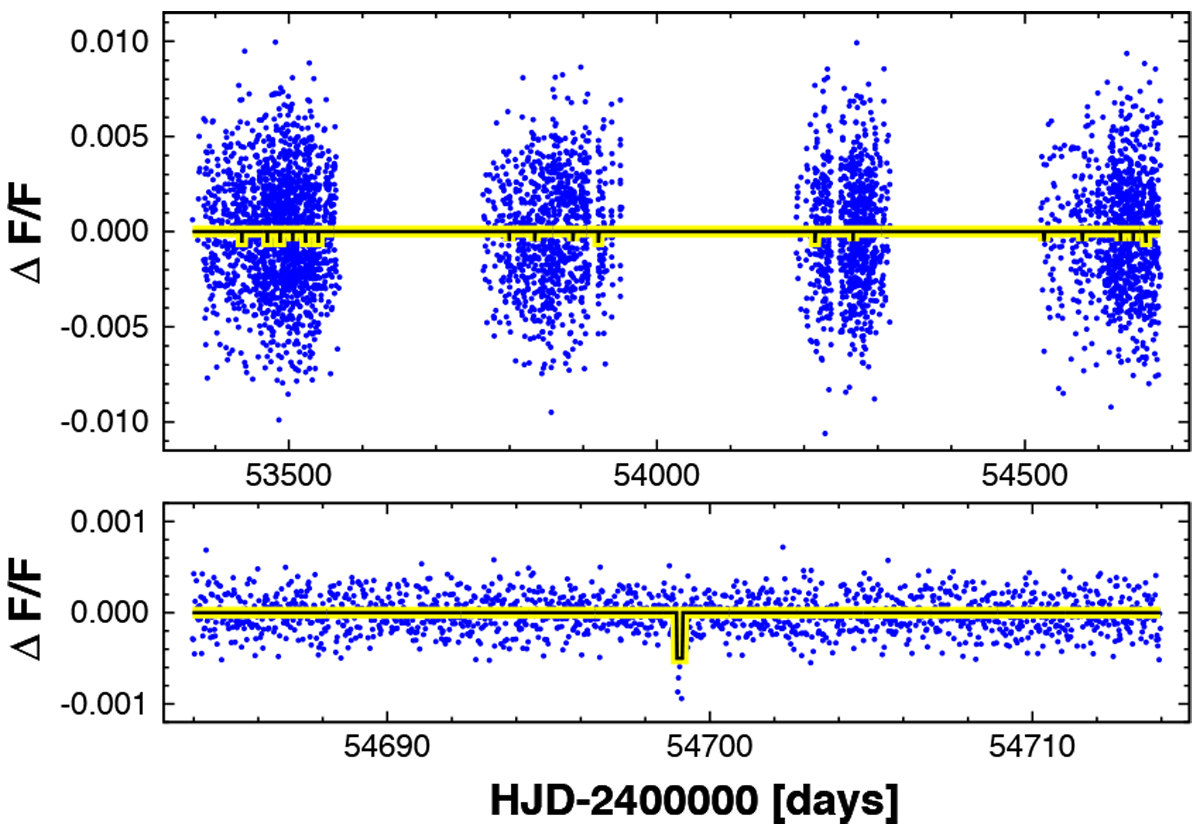
Simulated time series exhibiting the overall characteristics of the signals generated on the time distribution of sets H2 and T0 (upper and lower panels, respectively). The synthetic signal is shown by the black continuous line (in a yellow silhouette for better visibility). The signal parameters are P = 17.3 d, δ = 0.0005, t14∕P = 0.011, σT0 = 0.0002, and σH2 = 0.003 (see also Table 1). Only every tenth data point is plotted for H2 for clarity.
Current usage metrics show cumulative count of Article Views (full-text article views including HTML views, PDF and ePub downloads, according to the available data) and Abstracts Views on Vision4Press platform.
Data correspond to usage on the plateform after 2015. The current usage metrics is available 48-96 hours after online publication and is updated daily on week days.
Initial download of the metrics may take a while.