Fig. 15
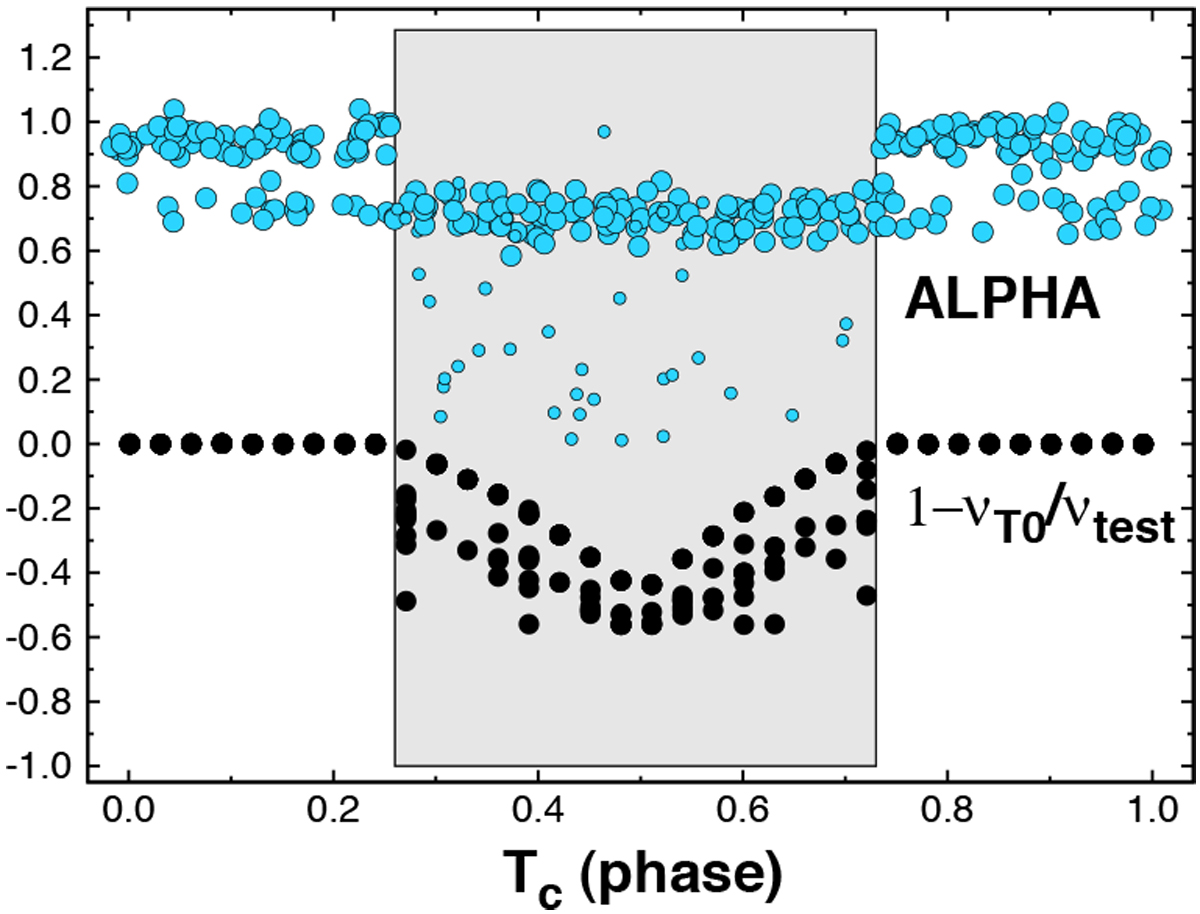
Dependence of the weight factor α of BLS3 onthe phase of the transit center in the case of intermediate periods, when two transits may be observed in the TESS data (T0) alone. The single-transit phase interval is indicated by the gray shaded box. The optimum α values are shown by the overlapping blue points (smaller dots mean no detection from the ten realizations we tested). We added a small noise to each point resulting from the grid scan to highlight the population density. Black dots indicate the relative peak frequency values for the primary dataset T0, indicating detection in the two-transit regime, and lack of it in the single-transit regime. See text for additional details.
Current usage metrics show cumulative count of Article Views (full-text article views including HTML views, PDF and ePub downloads, according to the available data) and Abstracts Views on Vision4Press platform.
Data correspond to usage on the plateform after 2015. The current usage metrics is available 48-96 hours after online publication and is updated daily on week days.
Initial download of the metrics may take a while.