Fig. 14
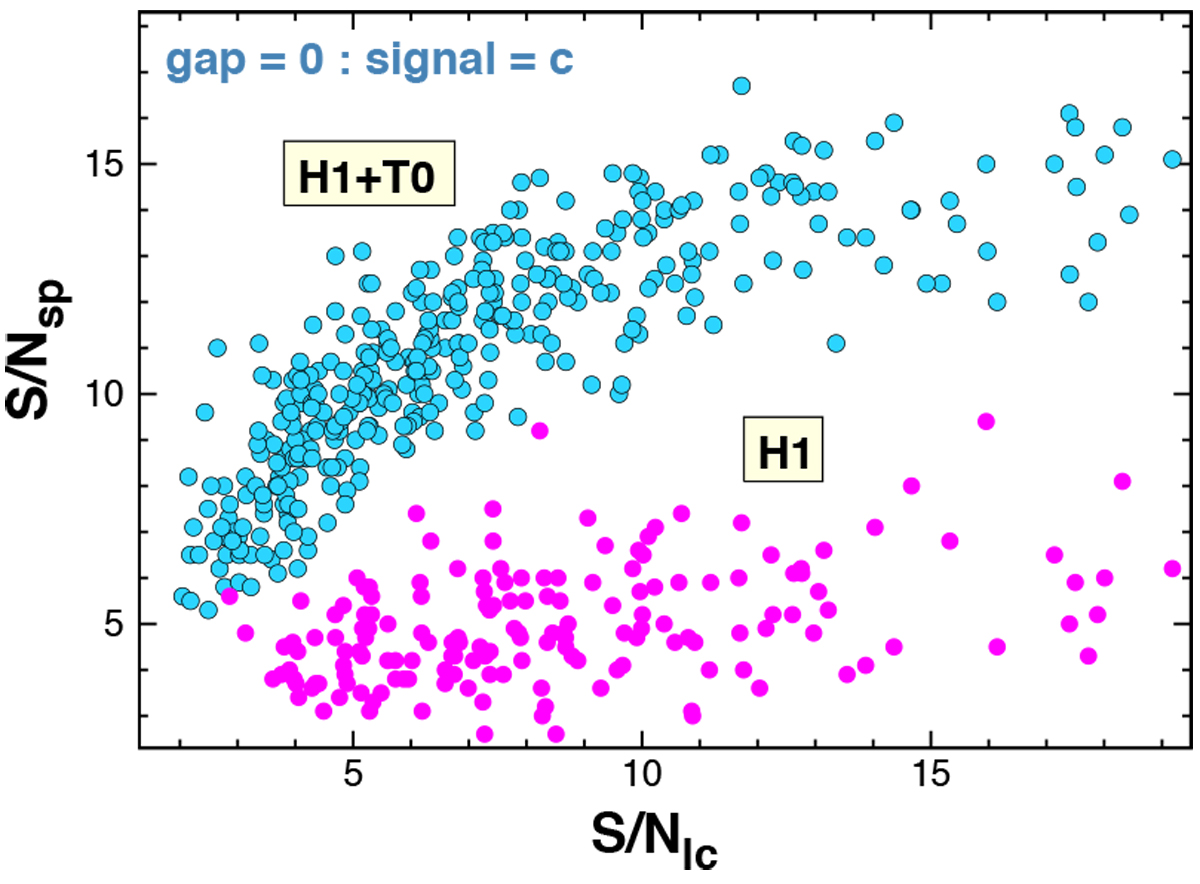
Signal-to-noise ratios derived from phase-folded time series S/Nlc vs. those of the corresponding BLS spectra, S/Nsp, for simulations satisfying the frequency criterion, condition b in Sect. 2.3. The joint analysis (by using BLS3) is capable of boosting even those signals that are otherwise buried deep in the noise (i.e., have S ∕Nlc < 3.0 in the “H1 alone” standard BLS analysis).
Current usage metrics show cumulative count of Article Views (full-text article views including HTML views, PDF and ePub downloads, according to the available data) and Abstracts Views on Vision4Press platform.
Data correspond to usage on the plateform after 2015. The current usage metrics is available 48-96 hours after online publication and is updated daily on week days.
Initial download of the metrics may take a while.