Fig. 13
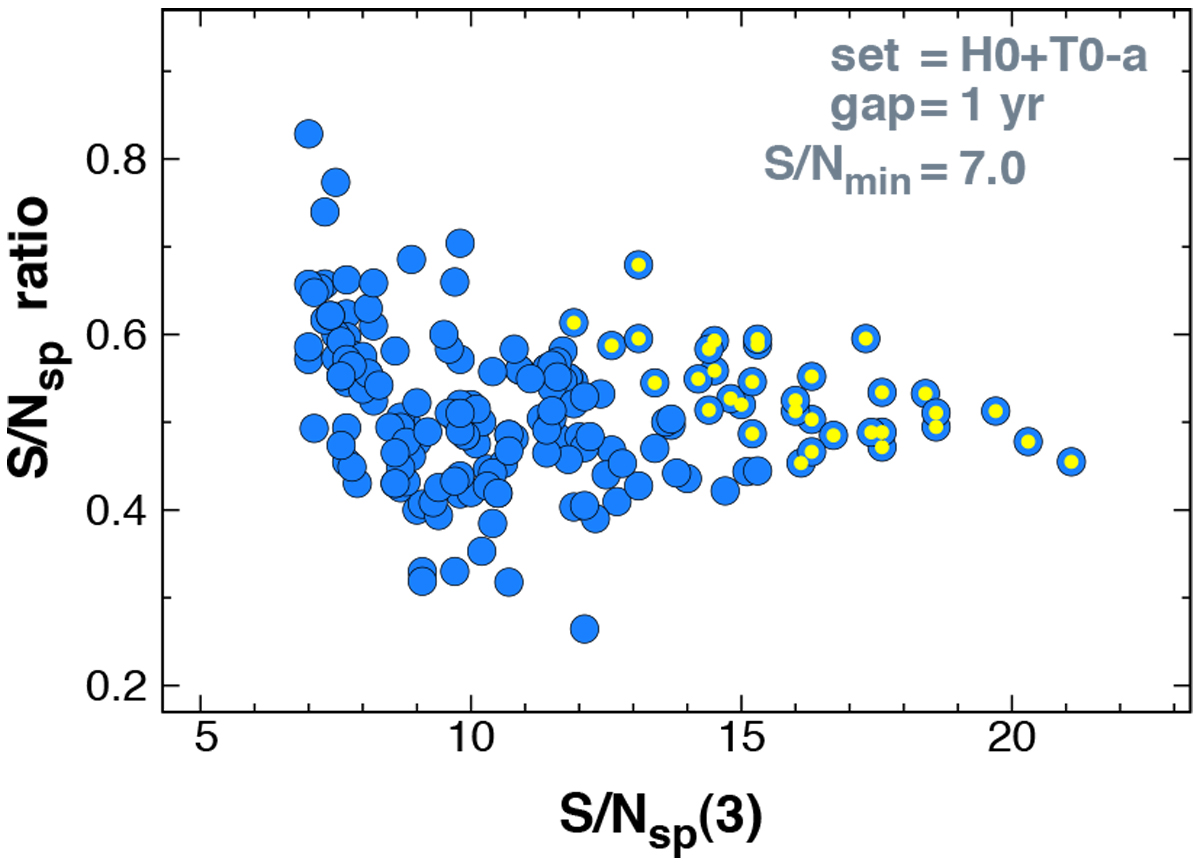
Comparison of the number of detections from the joint analysis by BLS3 (blue points) with those resulting from the standard BLS analysis of the secondary dataset H0 alone (yellow points). Spectrum S/N for the analysis by BLS3 on “H0+T0” is denoted by S/Nsp (3). The ordinate shows the ratio of the spectrum S/N values for “H0 alone” over “H0+T0”. Signal type a with 500 realizations was used.
Current usage metrics show cumulative count of Article Views (full-text article views including HTML views, PDF and ePub downloads, according to the available data) and Abstracts Views on Vision4Press platform.
Data correspond to usage on the plateform after 2015. The current usage metrics is available 48-96 hours after online publication and is updated daily on week days.
Initial download of the metrics may take a while.