Fig. 10
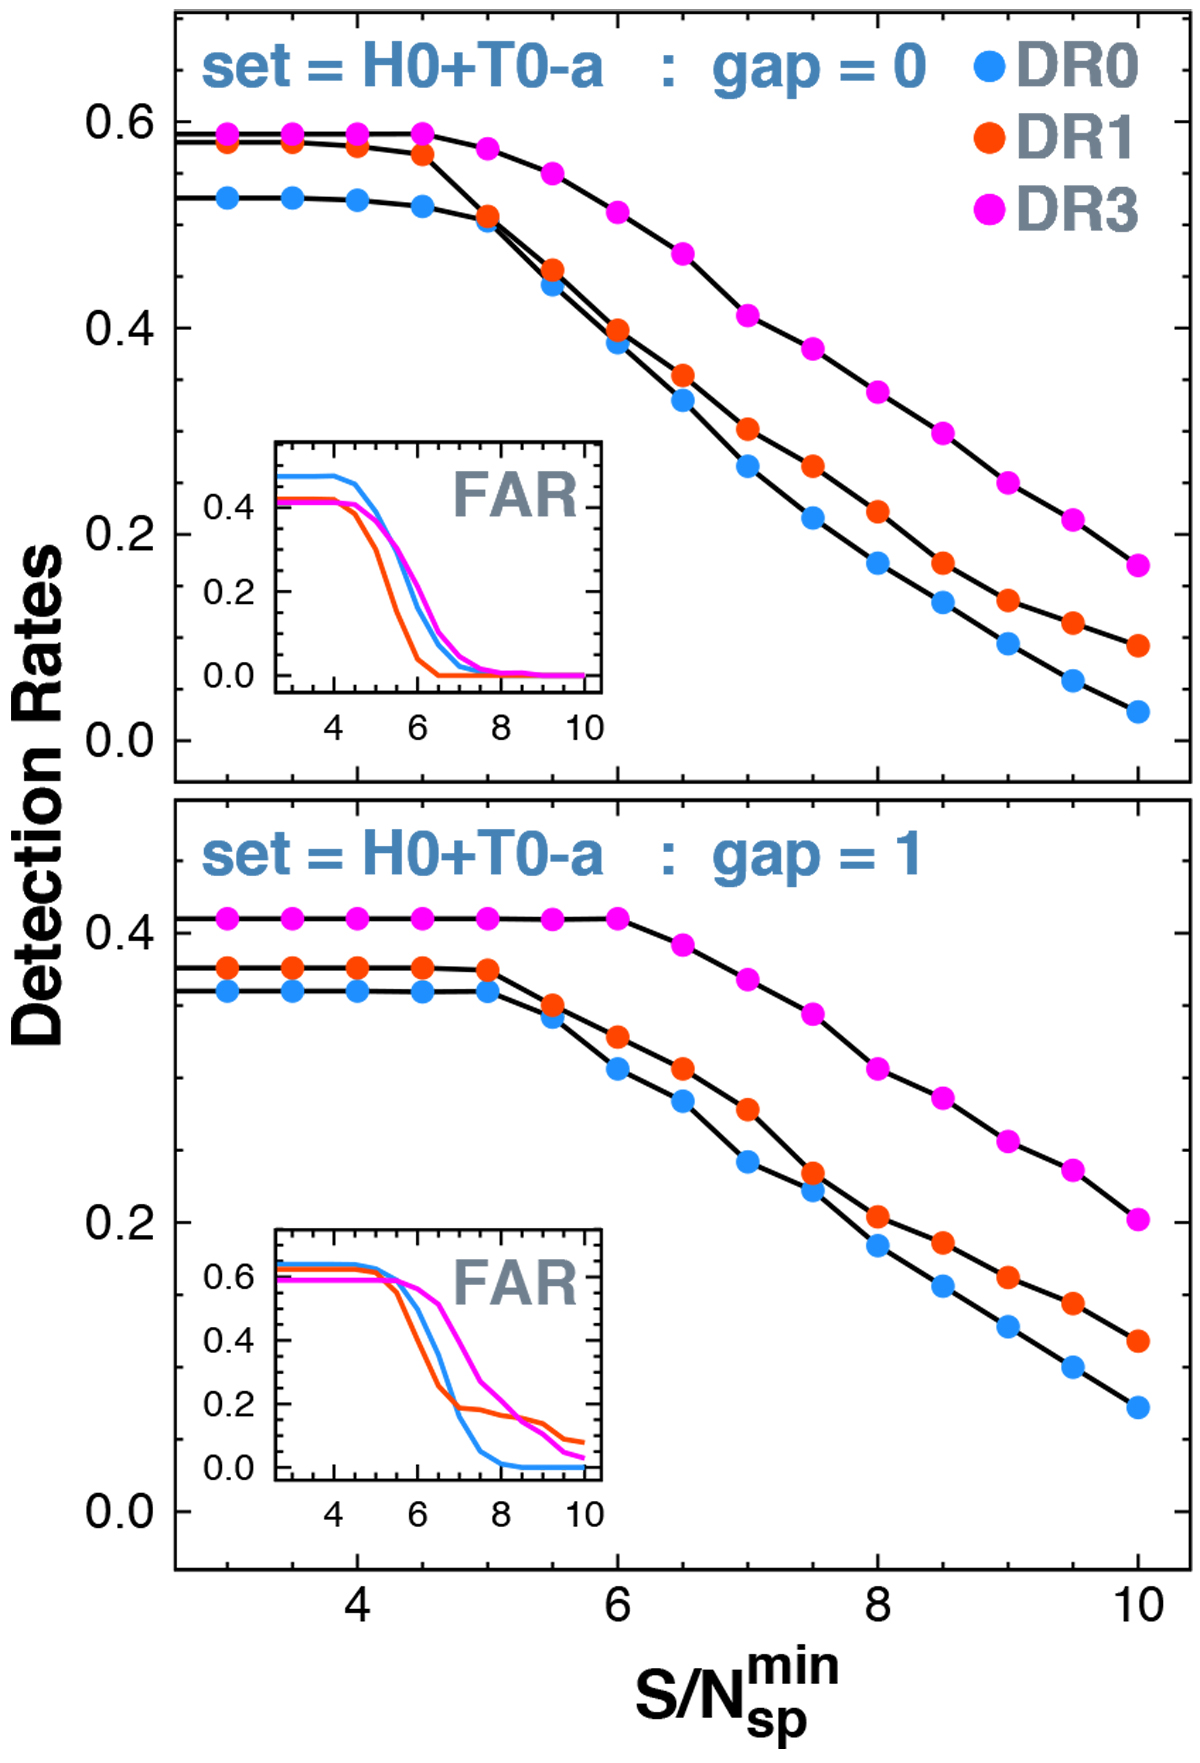
True detection rates for dataset H0+T0-a using various signal search methods (BLS0, BLS1, and BLS3 with respective detection rates of DR0, DR1, and DR3). Upper and lower panels: results obtained with zero and 1 yr gap between H0 and T0. The FARs used to correct the observed detection rates are displayed in the insets. For gapped data, the FAR increases considerably, leading to a decrease in the true detection rates.
Current usage metrics show cumulative count of Article Views (full-text article views including HTML views, PDF and ePub downloads, according to the available data) and Abstracts Views on Vision4Press platform.
Data correspond to usage on the plateform after 2015. The current usage metrics is available 48-96 hours after online publication and is updated daily on week days.
Initial download of the metrics may take a while.