Fig. 1
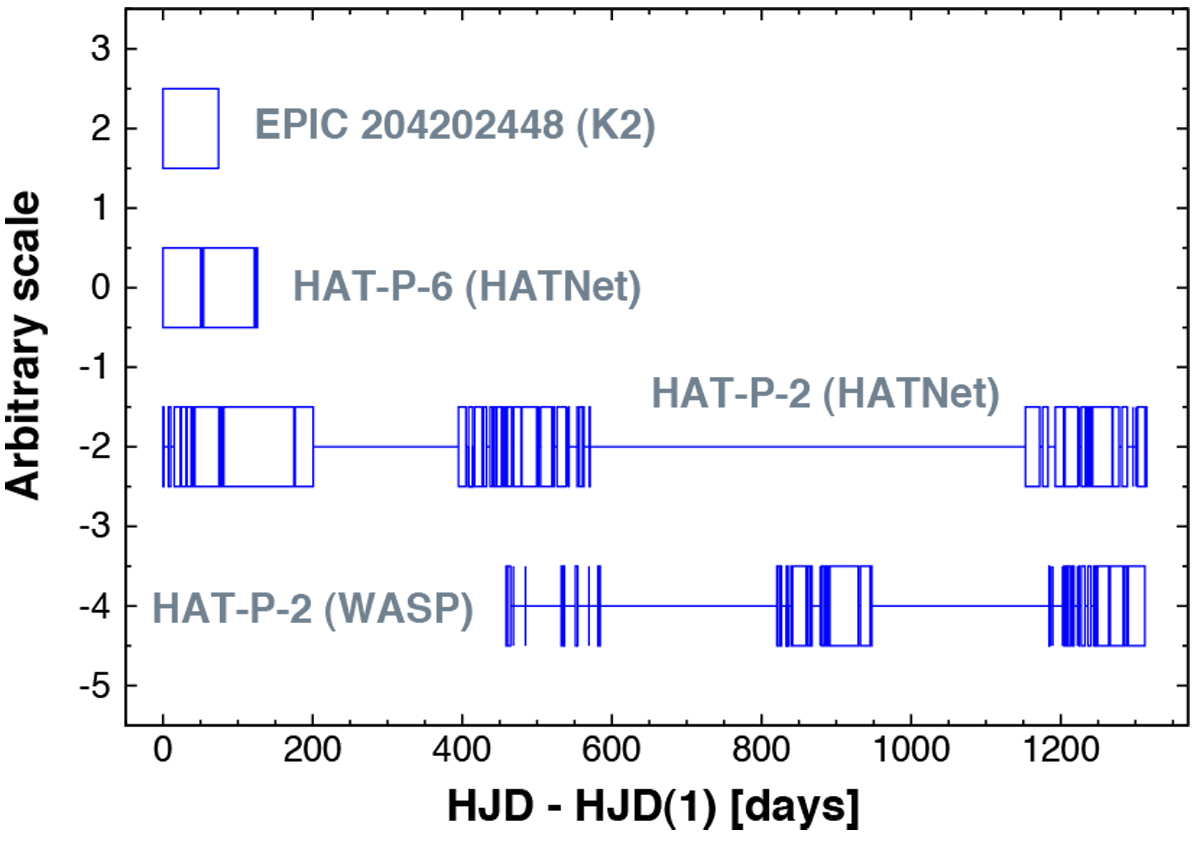
Time distribution of the secondary datasets used in combination with the mock TESS data to test search methods for periodic transit signals detected as single events in the TESS data. Each block represents a continuous dataset with gaps shorterthan one day. The data are plotted relative to the time at the first observation, HJD (1). The HATnet and WASP data on HAT-P-2 are merged in signal H2 (see Table 1) for the tests presented in this paper.
Current usage metrics show cumulative count of Article Views (full-text article views including HTML views, PDF and ePub downloads, according to the available data) and Abstracts Views on Vision4Press platform.
Data correspond to usage on the plateform after 2015. The current usage metrics is available 48-96 hours after online publication and is updated daily on week days.
Initial download of the metrics may take a while.