Open Access
Fig. 9.
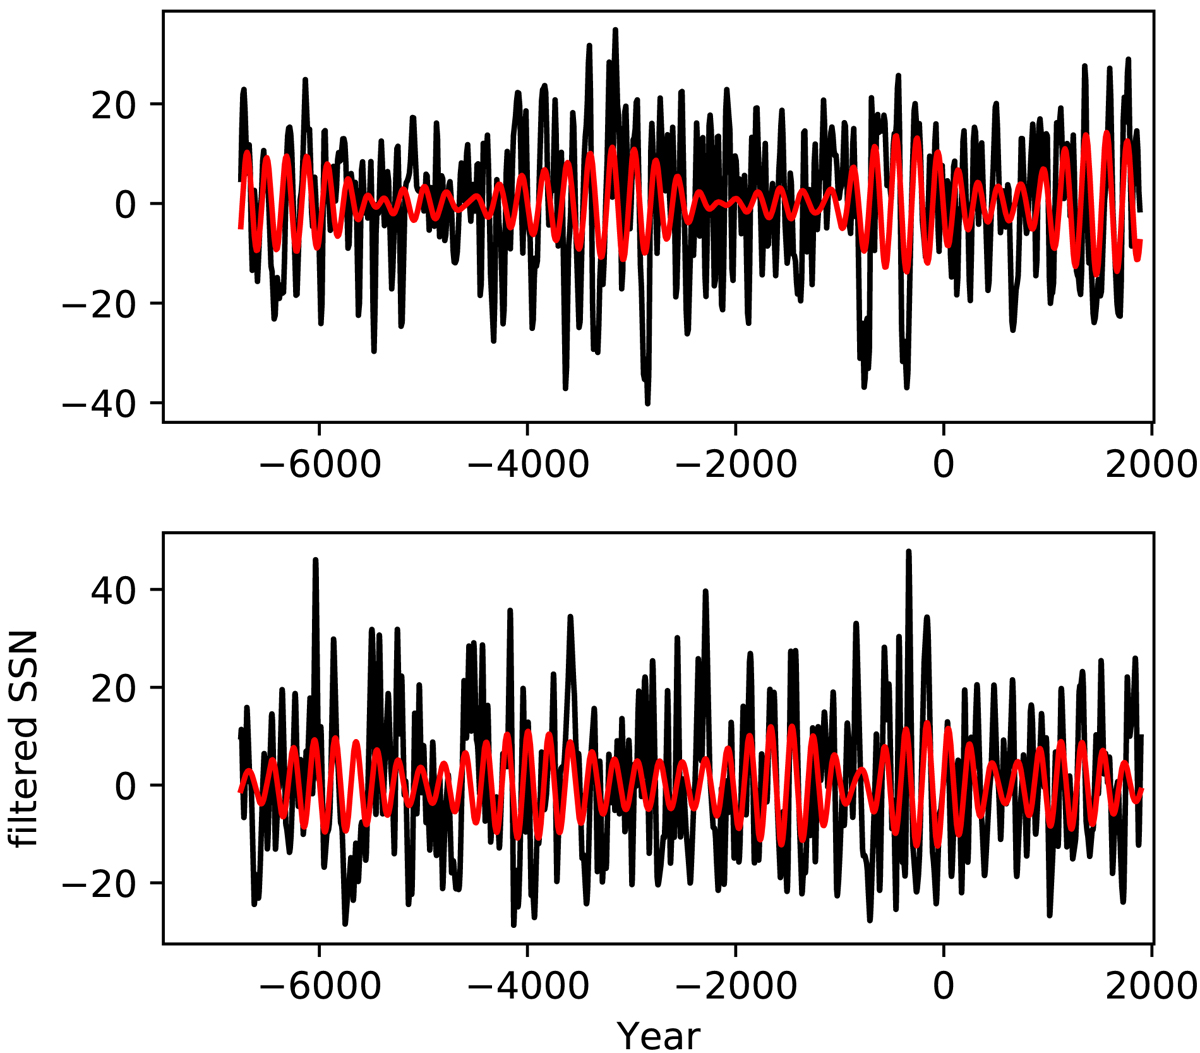
High-pass filtered records of the empirical (upper panel) and modeled sunspot numbers (lower panel). Overplotted in red are the corresponding bandpass-filtered records in the range of the de Vries period (cf. Fig. 8).
Current usage metrics show cumulative count of Article Views (full-text article views including HTML views, PDF and ePub downloads, according to the available data) and Abstracts Views on Vision4Press platform.
Data correspond to usage on the plateform after 2015. The current usage metrics is available 48-96 hours after online publication and is updated daily on week days.
Initial download of the metrics may take a while.