Open Access
Fig. 2.
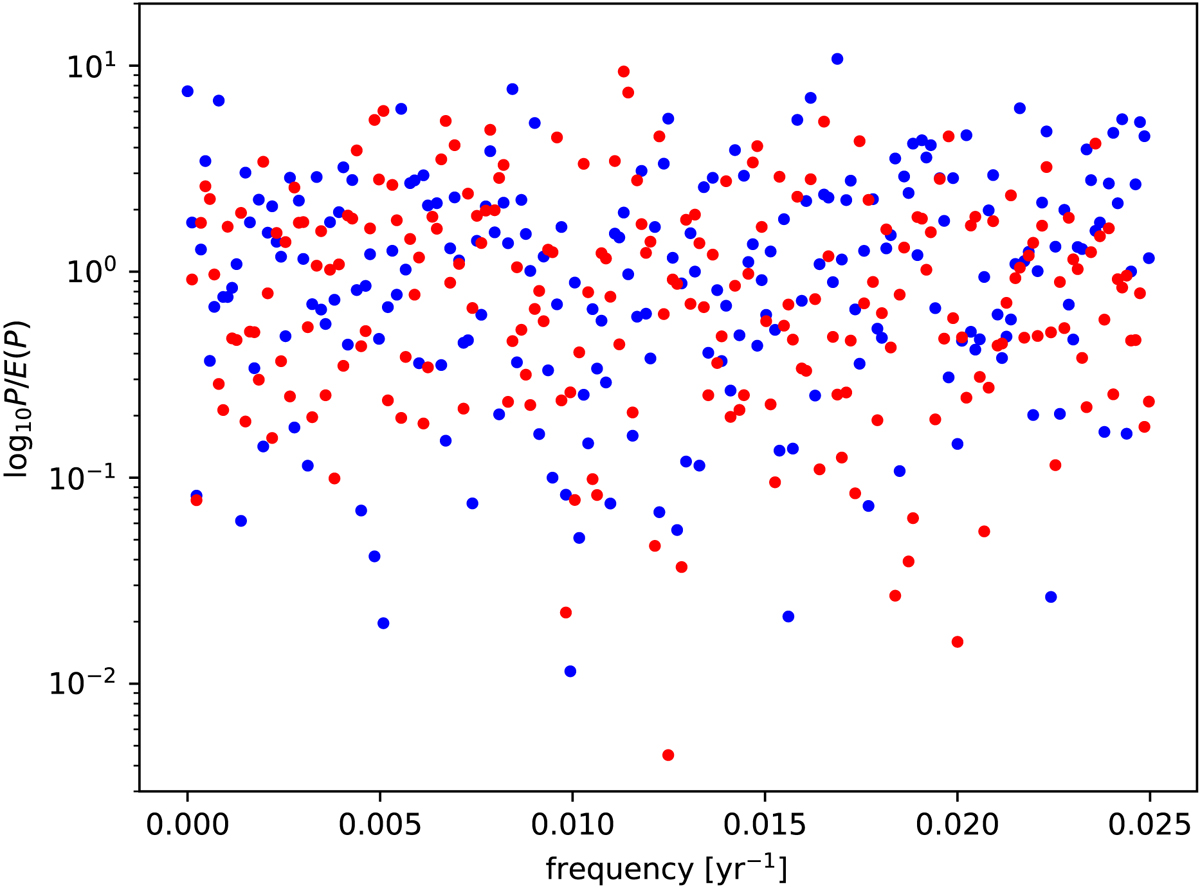
Ratio of the power in a frequency bin divided by the median power of the NNF model realizations at that frequency. The blue points correspond one realization of the noisy normal form model, the red points to the reconstruction from cosmogenic isotopes (cf. Fig. 1).
Current usage metrics show cumulative count of Article Views (full-text article views including HTML views, PDF and ePub downloads, according to the available data) and Abstracts Views on Vision4Press platform.
Data correspond to usage on the plateform after 2015. The current usage metrics is available 48-96 hours after online publication and is updated daily on week days.
Initial download of the metrics may take a while.