| Issue |
A&A
Volume 625, May 2019
|
|
|---|---|---|
| Article Number | L9 | |
| Number of page(s) | 5 | |
| Section | Letters to the Editor | |
| DOI | https://doi.org/10.1051/0004-6361/201935108 | |
| Published online | 17 May 2019 | |
Letter to the Editor
Gaia-assisted selection of a quasar reddened by dust in an extremely strong damped Lyman-α absorber at z = 2.226
1
Instituto de Astrofísica de Canarias, Vía Láctea, s/n, 38205 La Laguna, Tenerife, Spain
e-mail: This email address is being protected from spambots. You need JavaScript enabled to view it.
2
Gran Telescopio Canarias (GRANTECAN), 38205 San Cristóbal de La Laguna, Tenerife, Spain
3
Centre for Astrophysics and Cosmology, Science Institute, University of Iceland, Dunhagi 5, 107 Reykjavík, Iceland
4
Cosmic Dawn Center (DAWN), Copenhagen, Denmark
5
Niels Bohr Institute, University of Copenhagen, Lyngbyvej 2, 2100 Copenhagen Ø, Denmark
6
European Southern Observatory, Alonso de Córdova 3107, Vitacura, Casilla 19001, Santiago, Chile
7
DARK, Niels Bohr Institute, University of Copenhagen, Lyngbyvej 2, 2100 Copenhagen Ø, Denmark
8
Institut d’Astrophysique de Paris, CNRS-UPMC, UMR7095, 98bis Boulevard Arago, 75014 Paris, France
9
European Southern Observatory, Karl-Schwarzschildstraße 2, 85748 Garching, Germany
Received:
22
January
2019
Accepted:
4
April
2019
Abstract
Damped Lyman-α absorbers (DLAs) as a class of quasi-stellar object (QSO) absorption-line systems are currently our most important source of detailed information on the cosmic chemical evolution of galaxies. However, the degree to which this information is biased by dust remains to be understood. One strategy is to specifically search for QSOs that are reddened by metal-rich and dusty foreground absorbers. In this Letter, we present the discovery of a z = 2.60 QSO that is strongly reddened by dust in an intervening extremely strong DLA at z = 2.226. This QSO was identified through a novel selection that combined the astrometric measurements from ESA’s Gaia satellite with extisting optical and near- to mid-infrared photometry. We infer a total neutral atomic-hydrogen column density of log N(H I) = 21.95 ± 0.15 and a lower limit on the gas-phase metallicity of [Zn/H] > −0.96. This DLA is also remarkable in that it exhibits shielded neutral gas that is visible in C I, and it shows tentative detections of CO molecular bands. The spectral energy distribution of the QSO is well accounted for by a spectral energy distribution that is normal for a QSO and is reddened by dust from a DLA with 10% solar metallicity, a dust extinction of AV = 0.82 ± 0.02 mag, and an extinction curve that resembles that of the Large Magellanic Cloud, including the characteristic 2175 Å extinction feature. Such QSO absorption-line systems have been shown to be very rare in previous surveys, which have mostly revealed sight-lines with low extinction. The present case therefore suggests that previous samples have under-represented the fraction of dusty absorbers. Building a complete sample of such systems is required to assess the significance of this effect.
Key words: quasars: general / quasars: absorption lines / quasars: individual: GQ1218+0832 / dust, extinction
© ESO 2019
1. Introduction
Damped Lyman-α absorbers (DLAs) have been used to study the cosmic chemical evolution of galaxies for almost 30 years (e.g. Pettini et al. 1990; De Cia et al. 2018). Huge progress has been made, and large samples of well-studied systems are now available (e.g. Berg et al. 2016, and references therein). From the beginning of this line of research, it was clear that despite the enormous advantage of the method in obtaining detailed information on the properties of otherwise nearly invisible galaxies, the presence of dust would bias the cosmic chemical evolution history derived this way. The reason is that DLAs are identified in quasi-stellar object (QSO) spectra, and the presence of dust inevitably affects the likelihood of identifying QSOs in most types of QSO selection (Fall & Pei 1989; Pei et al. 1991, 1999).
The study of red and/or dust-obscured QSOs also has a long and intricate history (e.g. Ostriker & Heisler 1984; Webster et al. 1995; Benn et al. 1998; Warren et al. 2000; Glikman et al. 2006, 2013, 2018; Fynbo et al. 2013; Banerji et al. 2015; Hamann et al. 2017). Despite some disagreement among studies about the exact fraction of QSOs that is missed due to reddening, it is clear that a substantial number of QSOs are missed when they are selected by their optical colours alone.
A range of studies has attempted to gauge the importance of dust bias in DLA samples. Direct measurements of the effect of dust reddening have typically found very small amounts of excess reddening in samples of QSOs with intervening DLAs (Murphy & Bernet 2016, and references therein). These studies used to analyse optically selected QSO samples, however. Radio-selected samples (which are free from dust bias as long as the optical follow-up is 100% complete) have been built (Ellison et al. 2001, 2005; Jorgenson et al. 2006), but are small, and there is room for a substantial amount of missing metals due to dust-bias (Jorgenson et al. 2006; Pontzen & Pettini 2009).
Our group has specifically aimed at finding examples of QSOs that are reddened by intervening dust-rich DLAs using new QSO-selection techniques (Fynbo et al. 2013; Krogager et al. 2015, 2016a). We have found several such systems, which shows that dust bias exists and that our methods succeed in locating examples of DLAs that have dropped out of optically selected QSO samples (Krogager et al. 2016b; Fynbo et al. 2017; Heintz et al. 2018a). Our ambition is to build complete samples of quasars, and within such samples, identify examples of very metal-rich sight-lines, which are interesting for deep spectroscopic follow-up studies. This is challenging because of the overlap with cool stars for point sources that are red in optical bands. This problem can be alleviated by constructing a complete and (in terms of colour) unbiased sample based on astrometric data, specifically from the second Gaia data-release (Gaia-DR2; Gaia Collaboration 2018), removing sources with significant proper motions that are not extragalactic (Heintz et al. 2015, 2018b).
This Letter is organized as follows. In Sect. 2 we present the spectroscopic observations of a newly discovered z = 2.60 QSO with celestial coordinates: RA = 12:18:30.10, Dec = 08:32:15.5 (J2000.0), called GQ 1218+0832, reddened by dust in a foreground DLA. In Sect. 3 we present our results on the characteristics of this DLA, constraining its metallicity and induced QSO extinction. We draw our conclusions in Sect. 4.
2. Target selection and observations
We have built our parent QSO catalogue using a novel combination (Heintz et al. 2018b) of astrometry from Gaia-DR2 and photometry from the optical Sloan Digital Sky Survey data release 12 (SDSS-DR12; Eisenstein et al. 2011), the near-infrared UKIDSS (Warren et al. 2007), and the mid-infrared all-sky WISE mission (Cutri et al. 2013). We confined the sample to a region of the sky of Galactic latitude b > 60° to limit the contamination by Galactic sources. We only considered targets listed as point sources in both SDSS and UKIDSS and then only included sources with total proper motions 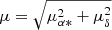 consistent with zero within 2σ, that is, a signal-to-noise ratio, S/Nμ = μ/μerr < 2 (following Heintz et al. 2018b, see Fig. 1). To be as complete as possible, we initially only imposed the zero-proper motion criterion. However, as a significant number of stars were still present, we imposed the additional near- to mid-infrared criteria shown in the bottom panel of Fig. 1 to exclude the large majority of stellar contaminants. Following Heintz et al. (2018a), we also imposed the optical colour criteria u − g > 1 and r − z > 0.5 to specifically target dust-reddened QSOs at z > 2.
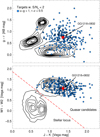 |
Fig. 1. Contour plots showing the optical and near-infrared point sources at b > 60° after the imposed 2σ zero proper-motion cut. In the upper panel, we display the SDSS g − r vs. UKIDSS J − K colours, and in the bottom panel, the WISE W1 − W2 vs. UKIDSS J − K colours of the sources in the parent sample. Our near- to mid-infrared colour criterion is represented by the red dashed line. The optically red targets with u − g > 1 and r − z > 0.5 colours are displayed as blue filled circles, and GQ 1218+0832 is marked with a red square. |
The object discussed in this Letter, designated GQ 1218+0832, was observed as part of a larger spectroscopic campaign. It has r = 20.35, g − r = 1.07, and J − K = 0.42 (AB mag) and is marked with a red square in Fig. 1.
Spectroscopic observations were obtained with the OSIRIS instrument at the Gran Telescopio Canarias (GTC). We gathered spectra using three different grisms in order to better constrain the QSO spectral energy distribution, and intervening metal and H I Lyα lines. The listed spectral resolution values are based on the measured widths of sky-emission lines. The observing log is given in Table 1.
Log of OSIRIS observations.
The spectroscopic data were reduced using standard IRAF1 procedures. The spectra were flux-calibrated using observations of spectro-photometric standard stars observed on each night. Both the spectra and the photometric data points were corrected for Galactic extinction using the dust maps from Schlafly & Finkbeiner (2011). All reported wavelengths are in vacuum and corrected to the heliocentric rest-frame. To improve the absolute flux calibration and correct for slit-loss, we scaled the observed spectra to the r-band photometry from SDSS.
3. Results
We display the GTC R1000B spectrum in Fig. 2, together with the optical and near- to mid-infrared photometry from SDSS, UKIDSS, and WISE. We identify an extremely strong DLA (hereafter ES-DLA; Noterdaeme et al. 2014) at a redshift of z = 2.2261 based on a range of associated metal lines (see Table 2).
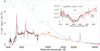 |
Fig. 2. GTC R1000B spectrum of the z = 2.60 QSO GQ 1218+0832 displayed together with the photometry from SDSS, UKIDSS, and WISE, in the u, g, r, i, z, Y, J, H, Ks, and W1 bands (Warren et al. 2007; Wright et al. 2010; Eisenstein et al. 2011). Overplotted is the composite QSO spectrum from Selsing et al. (2016; in blue) and the same composite reddened by AV = 0.82 ± 0.02 mag assuming LMC-type dust at the redshift of the DLA (in red). Models with and without the 2175 Å dust extinction feature are shown. The inset shows a zoom-in on the blue part of the spectrum around the H I Lyα line from the z = 2.2261 absorber. The red dashed line is the modelled QSO continuum. Also overplotted is the H I DLA Voigt-profile fit, which is included in the dust-reddened QSO composite spectrum, with N(H I) = 1021.95 ± 0.15 cm−2. |
Absorption lines from the z = 2.2261 ± 0.0004 DLA detected in the GTC R2500V and R2500R spectra.
3.1. Extinction
The spectrum of the background QSO is inconspicuous except for its reddening. Because the QSO looks “normal”, it is well suited for determining the extinction curve of dust in the intervening ES-DLA.
To derive the amount of extinction, we used the composite QSO template from Selsing et al. (2016), including a range of different extinction models. We followed the parametrization of Gordon et al. (2003) and fit the extinguished spectrum assuming a dust composition similar to the Small and Large Magellanic Clouds (SMC and LMC). We find the best fit to be an LMC-type extinction curve with a visual extinction of AV = 0.82 ± 0.02 mag, including the 2175 Å dust extinction feature. We measure a bump strength of Abump = 0.38 mag (following the definition in Gordon et al. 2003).
3.2. Absorption lines
In the inset of Fig. 2 we show a zoom-in on the damped Lyman-α absorption line. To derive the H I column density of the absorber, we included a DLA in the dust-reddened QSO model (using the approximation by Tepper-García 2006). From the best-fit model, we find log N(H I) = 21.95 ± 0.15.
We also detect a range of metal lines associated with the DLA, as well as another intervening system at z = 2.247 seen in C IV and Si IV. In Table 2 we list the equivalent width (EW) and redshift measurements drawn from the R2500V and R2500R spectra. The average redshift of the system inferred from the low-ionization lines listed in the table is z = 2.2261 ± 0.0004.
We fitted Voigt profiles to the low-ionisation metal lines and derived the following lower limits on the abundances: [Zn/H] > −0.96, [Si/H] > −1.23, [Fe/H] > −1.89, and [Cr/H] > −1.64, using the solar photospheric abundances from Asplund et al. (2009). Because of the limited resolution of the spectra, these abundances should be considered cautiously and only treated as lower limits due to saturation. Taken at face value, our measurements indicate an overall metallicity of at least 10% solar and significant depletion of refractory elements, for example, [Fe/Zn] ∼ −1.
We detect clear absorption signatures of C I, but because the spectral resolution is limited, the transitions from the ground state and fine-structure energy levels are blended. Remarkably, there are consistent features also at the expected locations of CO molecular bands (see Fig. 3). A deeper spectrum with higher resolution is required to confirm the presence of these lines.
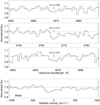 |
Fig. 3. GTC R2500V spectrum showing tentative detection of CO A-X bands. In the bottom panel, the geometric mean of the profiles is shown, revealing the line-profile asymmetry. |
4. Discussion and conclusions
In Fig. 4 we compare the metallicity and H I column density of the system to the general population of QSO-DLAs from De Cia et al. (2018), gamma-ray burst (GRB)-DLAs from Bolmer et al. (2019), the extreme case of GRB 080607 from Prochaska et al. (2009), and the compiled sample of dusty (AV > 0.1 mag) DLAs from Heintz et al. (2018a), including the recent discovery by Ranjan et al. (2018). Compared to other QSO-DLAs, the absorption system towards GQ 1218+0832 is remarkable in several ways. Firstly, such a high H I column density is very rare in the general population of QSO absorbers (Bird et al. 2017). Even within the population of extremely strong QSO-DLAs, this system has higher-than-average metal-line strengths, depletion factors, and H I column density (Noterdaeme et al. 2014). Its H I column density is more similar to the column densities found in GRB-DLAs (see also Tanvir et al. 2019). This DLA is also unusual through the presence of C I and possibly CO absorption. The incidence of C I absorbers with Wr(λ1560) > 0.4 Å is about 100 times less frequent than that of QSO-DLAs (Ledoux et al. 2015). The presence of strong C I lines is an indicator of high metallicity and diffuse molecular gas, and Noterdaeme et al. (2018) found that all such systems present H2 and a significant fraction of them exhibit CO at a detectable level. This suggests that CO lines are likely to be detected in this system as well, in agreement with the presence of consistent dips in the spectrum. This system provides further evidence that ES-DLAs (with N(H I) > 1021.7 cm−2) lie in the transition regime where H I is being converted into H2 (Schaye 2001; Noterdaeme et al. 2015; Balashev & Noterdaeme 2018).
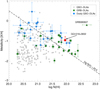 |
Fig. 4. Metallicity vs. H I column density. Typical QSO-DLAs with metallicities from the literature (De Cia et al. 2018) are displayed as grey crosses. The sample of GRB-DLAs from Bolmer et al. (2019) is shown with green squares, and the remarkable GRB 080607 presented in Prochaska et al. (2009) is marked with a green upward-facing triangle. A sample of dusty (AV > 0.1 mag, compiled by Heintz et al. 2018a) QSO-DLAs is shown with blue circles. The dashed line corresponds to a fixed metal column density, i.e. log N(X) = log N(H I) + [X/H] = 20.5 (see also Boissé et al. 1998). The ES-DLA towards GQ 1218+0832 studied here is marked with a red square, indicating the lower limit on the metallicity. It is one of the most metal-rich ES-DLAs discovered to date. |
This case, in terms of extinction and molecular content, is the most remarkable example so far of a QSO that was missed by traditional optical-colour selections due to dust in an intervening galaxy, as predicted by Fall & Pei (1989). How many quasars would be missed if they had a DLA in their line of sight with the same level of extinction as in the present case? The answer to this question is complex, as the effect of dust depends on the redshift of the quasar, the redshift of the DLA, and the colour distribution of stellar populations. In this survey, we find that the fraction of candidate quasars with the same red optical colours as the system presented here is ∼1%, compared to the full set of quasars that is identified based on the astrometric and near- to mid-infrared selection criteria detailed in Sect. 2. Krogager et al. (2019) have carried out a comprehensive analysis of the effect of dust in DLAs and found that while the fraction of quasars dropping out of selections is small, the effect on the derived mass density of neutral hydrogen and metals is much larger, up to a factor of 2 and 5 at z ∼ 2.2, respectively (see also Pontzen & Pettini 2009).
There is little doubt that more such systems are yet to be found. An important objective of future work will be to identify them. Another major endeavour will be to use the information of their incidence rate to build up a more complete picture of cosmic chemical evolution.
IRAF is distributed by the National Optical Astronomy Observatory, which is operated by the Association of Universities for Research in Astronomy (AURA) under a cooperative agreement with the National Science Foundation.
Acknowledgments
We thank the anonymous referee for a constructive report that helped improve the manuscript on important points. This work is based on observations carried out on the island of La Palma with the Gran Telescopio Canarias (GTC), installed at the Spanish Observatorio del Roque de los Muchachos belonging to the Instituto de Astrofísica de Canarias. The Cosmic Dawn Center is funded by the DNRF. KEH and PJ acknowledge support from a Project Grant (162948–051) of The Icelandic Research Fund.
References
- Asplund, M., Grevesse, N., Sauval, A. J., & Scott, P. 2009, ARA&A, 47, 481 [NASA ADS] [CrossRef] [Google Scholar]
- Balashev, S. A., & Noterdaeme, P. 2018, MNRAS, 478, L7 [NASA ADS] [CrossRef] [Google Scholar]
- Banerji, M., Alaghband-Zadeh, S., Hewett, P. C., & McMahon, R. G. 2015, MNRAS, 447, 3368 [NASA ADS] [CrossRef] [Google Scholar]
- Benn, C. R., Vigotti, M., Carballo, R., Gonzalez-Serrano, J. I., & Sánchez, S. F. 1998, MNRAS, 295, 451 [NASA ADS] [CrossRef] [Google Scholar]
- Berg, T. A. M., Ellison, S. L., Sánchez-Ramírez, R., et al. 2016, MNRAS, 463, 3021 [NASA ADS] [CrossRef] [Google Scholar]
- Bird, S., Garnett, R., & Ho, S. 2017, MNRAS, 466, 2111 [NASA ADS] [CrossRef] [Google Scholar]
- Boissé, P., Le Brun, V., Bergeron, J., & Deharveng, J.-M. 1998, A&A, 333, 841 [NASA ADS] [Google Scholar]
- Bolmer, J., Ledoux, C., Wiseman, P., et al. 2019, A&A, 623, A43 [NASA ADS] [CrossRef] [EDP Sciences] [Google Scholar]
- Cutri, R. M., Wright, E. L., Conrow, T., et al. 2013, Explanatory Supplement to the AllWISE Data Release Products, Tech. rep. [Google Scholar]
- De Cia, A., Ledoux, C., Petitjean, P., & Savaglio, S. 2018, A&A, 611, A76 [NASA ADS] [CrossRef] [EDP Sciences] [Google Scholar]
- Eisenstein, D. J., Weinberg, D. H., Agol, E., et al. 2011, AJ, 142, 72 [Google Scholar]
- Ellison, S. L., Yan, L., Hook, I. M., et al. 2001, A&A, 379, 393 [NASA ADS] [CrossRef] [EDP Sciences] [Google Scholar]
- Ellison, S. L., Hall, P. B., & Lira, P. 2005, AJ, 130, 1345 [NASA ADS] [CrossRef] [Google Scholar]
- Fall, S. M., & Pei, Y. C. 1989, ApJ, 337, 7 [NASA ADS] [CrossRef] [Google Scholar]
- Fynbo, J. P. U., Krogager, J.-K., Venemans, B., et al. 2013, ApJS, 204, 6 [NASA ADS] [CrossRef] [Google Scholar]
- Fynbo, J. P. U., Krogager, J.-K., Heintz, K. E., et al. 2017, A&A, 606, A13 [NASA ADS] [CrossRef] [EDP Sciences] [Google Scholar]
- Gaia Collaboration (Brown, A. G. A., et al.) 2018, A&A, 616, A1 [NASA ADS] [CrossRef] [EDP Sciences] [Google Scholar]
- Glikman, E., Helfand, D. J., & White, R. L. 2006, ApJ, 640, 579 [NASA ADS] [CrossRef] [Google Scholar]
- Glikman, E., Urrutia, T., Lacy, M., et al. 2013, ApJ, 778, 127 [NASA ADS] [CrossRef] [Google Scholar]
- Glikman, E., Lacy, M., LaMassa, S., et al. 2018, ApJ, 861, 37 [NASA ADS] [CrossRef] [Google Scholar]
- Gordon, K. D., Clayton, G. C., Misselt, K. A., Landolt, A. U., & Wolff, M. J. 2003, ApJ, 594, 279 [NASA ADS] [CrossRef] [EDP Sciences] [Google Scholar]
- Hamann, F., Zakamska, N. L., Ross, N., et al. 2017, MNRAS, 464, 3431 [NASA ADS] [CrossRef] [Google Scholar]
- Heintz, K. E., Fynbo, J. P. U., & Høg, E. 2015, A&A, 578, A91 [NASA ADS] [CrossRef] [EDP Sciences] [Google Scholar]
- Heintz, K. E., Fynbo, J. P. U., Ledoux, C., et al. 2018a, A&A, 615, A43 [NASA ADS] [CrossRef] [EDP Sciences] [Google Scholar]
- Heintz, K. E., Fynbo, J. P. U., Høg, E., et al. 2018b, A&A, 615, L8 [NASA ADS] [CrossRef] [EDP Sciences] [Google Scholar]
- Jorgenson, R. A., Wolfe, A. M., Prochaska, J. X., et al. 2006, ApJ, 646, 730 [NASA ADS] [CrossRef] [Google Scholar]
- Krogager, J.-K., Geier, S., Fynbo, J. P. U., et al. 2015, ApJS, 217, 5 [NASA ADS] [CrossRef] [Google Scholar]
- Krogager, J.-K., Fynbo, J. P. U., Heintz, K. E., et al. 2016a, ApJ, 832, 49 [NASA ADS] [CrossRef] [Google Scholar]
- Krogager, J.-K., Fynbo, J. P. U., Noterdaeme, P., et al. 2016b, MNRAS, 455, 2698 [NASA ADS] [CrossRef] [Google Scholar]
- Krogager, J. K., Fynbo, J. P. U., Møller, P., et al. 2019, MNRAS, in press [arXiv:1904.06966] [Google Scholar]
- Ledoux, C., Noterdaeme, P., Petitjean, P., & Srianand, R. 2015, A&A, 580, A8 [NASA ADS] [CrossRef] [EDP Sciences] [Google Scholar]
- Murphy, M. T., & Bernet, M. L. 2016, MNRAS, 455, 1043 [NASA ADS] [CrossRef] [Google Scholar]
- Noterdaeme, P., Petitjean, P., Pâris, I., et al. 2014, A&A, 566, A24 [NASA ADS] [CrossRef] [EDP Sciences] [Google Scholar]
- Noterdaeme, P., Petitjean, P., & Srianand, R. 2015, A&A, 578, L5 [NASA ADS] [CrossRef] [EDP Sciences] [Google Scholar]
- Noterdaeme, P., Ledoux, C., Zou, S., et al. 2018, A&A, 612, A58 [Google Scholar]
- Ostriker, J. P., & Heisler, J. 1984, ApJ, 278, 1 [NASA ADS] [CrossRef] [Google Scholar]
- Pei, Y. C., Fall, S. M., & Bechtold, J. 1991, ApJ, 378, 6 [NASA ADS] [CrossRef] [Google Scholar]
- Pei, Y. C., Fall, S. M., & Hauser, M. G. 1999, ApJ, 522, 604 [NASA ADS] [CrossRef] [Google Scholar]
- Pettini, M., Boksenberg, A., & Hunstead, R. W. 1990, ApJ, 348, 48 [NASA ADS] [CrossRef] [Google Scholar]
- Pontzen, A., & Pettini, M. 2009, MNRAS, 393, 557 [NASA ADS] [CrossRef] [Google Scholar]
- Prochaska, J. X., Sheffer, Y., Perley, D. A., et al. 2009, ApJ, 691, L27 [NASA ADS] [CrossRef] [Google Scholar]
- Ranjan, A., Noterdaeme, P., Krogager, J.-K., et al. 2018, A&A, 618, A184 [NASA ADS] [CrossRef] [EDP Sciences] [Google Scholar]
- Schaye, J. 2001, ApJ, 562, L95 [NASA ADS] [CrossRef] [Google Scholar]
- Schlafly, E. F., & Finkbeiner, D. P. 2011, ApJ, 737, 103 [NASA ADS] [CrossRef] [Google Scholar]
- Selsing, J., Fynbo, J. P. U., Christensen, L., & Krogager, J.-K. 2016, A&A, 585, A87 [NASA ADS] [CrossRef] [EDP Sciences] [Google Scholar]
- Tanvir, N. R., Fynbo, J. P. U., de Ugarte Postigo, A., et al. 2019, MNRAS, 483, 5380 [NASA ADS] [CrossRef] [Google Scholar]
- Tepper-García, T. 2006, MNRAS, 369, 2025 [NASA ADS] [CrossRef] [Google Scholar]
- Warren, S. J., Hewett, P. C., & Foltz, C. B. 2000, MNRAS, 312, 827 [NASA ADS] [CrossRef] [Google Scholar]
- Warren, S. J., Hambly, N. C., Dye, S., et al. 2007, MNRAS, 375, 213 [NASA ADS] [CrossRef] [Google Scholar]
- Webster, R. L., Francis, P. J., Petersont, B. A., Drinkwater, M. J., & Masci, F. J. 1995, Nature, 375, 469 [NASA ADS] [CrossRef] [Google Scholar]
- Wright, E. L., Eisenhardt, P. R. M., Mainzer, A. K., et al. 2010, AJ, 140, 1868 [NASA ADS] [CrossRef] [Google Scholar]
All Tables
Absorption lines from the z = 2.2261 ± 0.0004 DLA detected in the GTC R2500V and R2500R spectra.
All Figures
|
Fig. 1. Contour plots showing the optical and near-infrared point sources at b > 60° after the imposed 2σ zero proper-motion cut. In the upper panel, we display the SDSS g − r vs. UKIDSS J − K colours, and in the bottom panel, the WISE W1 − W2 vs. UKIDSS J − K colours of the sources in the parent sample. Our near- to mid-infrared colour criterion is represented by the red dashed line. The optically red targets with u − g > 1 and r − z > 0.5 colours are displayed as blue filled circles, and GQ 1218+0832 is marked with a red square. |
| In the text | |
|
Fig. 2. GTC R1000B spectrum of the z = 2.60 QSO GQ 1218+0832 displayed together with the photometry from SDSS, UKIDSS, and WISE, in the u, g, r, i, z, Y, J, H, Ks, and W1 bands (Warren et al. 2007; Wright et al. 2010; Eisenstein et al. 2011). Overplotted is the composite QSO spectrum from Selsing et al. (2016; in blue) and the same composite reddened by AV = 0.82 ± 0.02 mag assuming LMC-type dust at the redshift of the DLA (in red). Models with and without the 2175 Å dust extinction feature are shown. The inset shows a zoom-in on the blue part of the spectrum around the H I Lyα line from the z = 2.2261 absorber. The red dashed line is the modelled QSO continuum. Also overplotted is the H I DLA Voigt-profile fit, which is included in the dust-reddened QSO composite spectrum, with N(H I) = 1021.95 ± 0.15 cm−2. |
| In the text | |
|
Fig. 3. GTC R2500V spectrum showing tentative detection of CO A-X bands. In the bottom panel, the geometric mean of the profiles is shown, revealing the line-profile asymmetry. |
| In the text | |
|
Fig. 4. Metallicity vs. H I column density. Typical QSO-DLAs with metallicities from the literature (De Cia et al. 2018) are displayed as grey crosses. The sample of GRB-DLAs from Bolmer et al. (2019) is shown with green squares, and the remarkable GRB 080607 presented in Prochaska et al. (2009) is marked with a green upward-facing triangle. A sample of dusty (AV > 0.1 mag, compiled by Heintz et al. 2018a) QSO-DLAs is shown with blue circles. The dashed line corresponds to a fixed metal column density, i.e. log N(X) = log N(H I) + [X/H] = 20.5 (see also Boissé et al. 1998). The ES-DLA towards GQ 1218+0832 studied here is marked with a red square, indicating the lower limit on the metallicity. It is one of the most metal-rich ES-DLAs discovered to date. |
| In the text | |
Current usage metrics show cumulative count of Article Views (full-text article views including HTML views, PDF and ePub downloads, according to the available data) and Abstracts Views on Vision4Press platform.
Data correspond to usage on the plateform after 2015. The current usage metrics is available 48-96 hours after online publication and is updated daily on week days.
Initial download of the metrics may take a while.