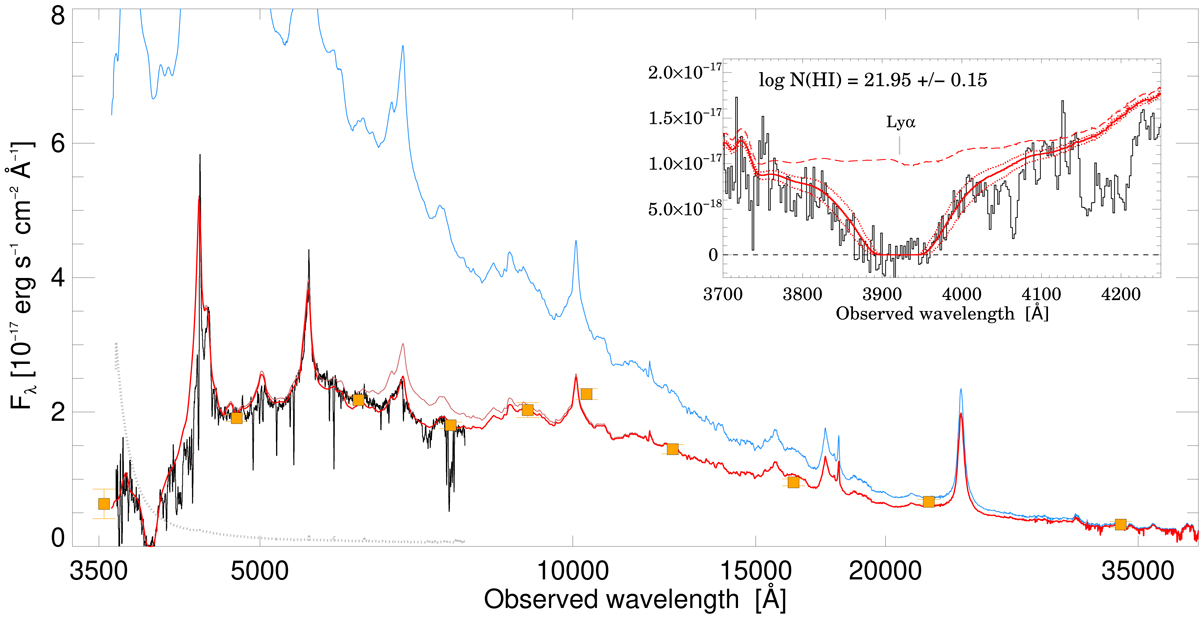
Fig. 2.

GTC R1000B spectrum of the z = 2.60 QSO GQ 1218+0832 displayed together with the photometry from SDSS, UKIDSS, and WISE, in the u, g, r, i, z, Y, J, H, Ks, and W1 bands (Warren et al. 2007; Wright et al. 2010; Eisenstein et al. 2011). Overplotted is the composite QSO spectrum from Selsing et al. (2016; in blue) and the same composite reddened by AV = 0.82 ± 0.02 mag assuming LMC-type dust at the redshift of the DLA (in red). Models with and without the 2175 Å dust extinction feature are shown. The inset shows a zoom-in on the blue part of the spectrum around the H I Lyα line from the z = 2.2261 absorber. The red dashed line is the modelled QSO continuum. Also overplotted is the H I DLA Voigt-profile fit, which is included in the dust-reddened QSO composite spectrum, with N(H I) = 1021.95 ± 0.15 cm−2.
Current usage metrics show cumulative count of Article Views (full-text article views including HTML views, PDF and ePub downloads, according to the available data) and Abstracts Views on Vision4Press platform.
Data correspond to usage on the plateform after 2015. The current usage metrics is available 48-96 hours after online publication and is updated daily on week days.
Initial download of the metrics may take a while.


