Fig. 1.
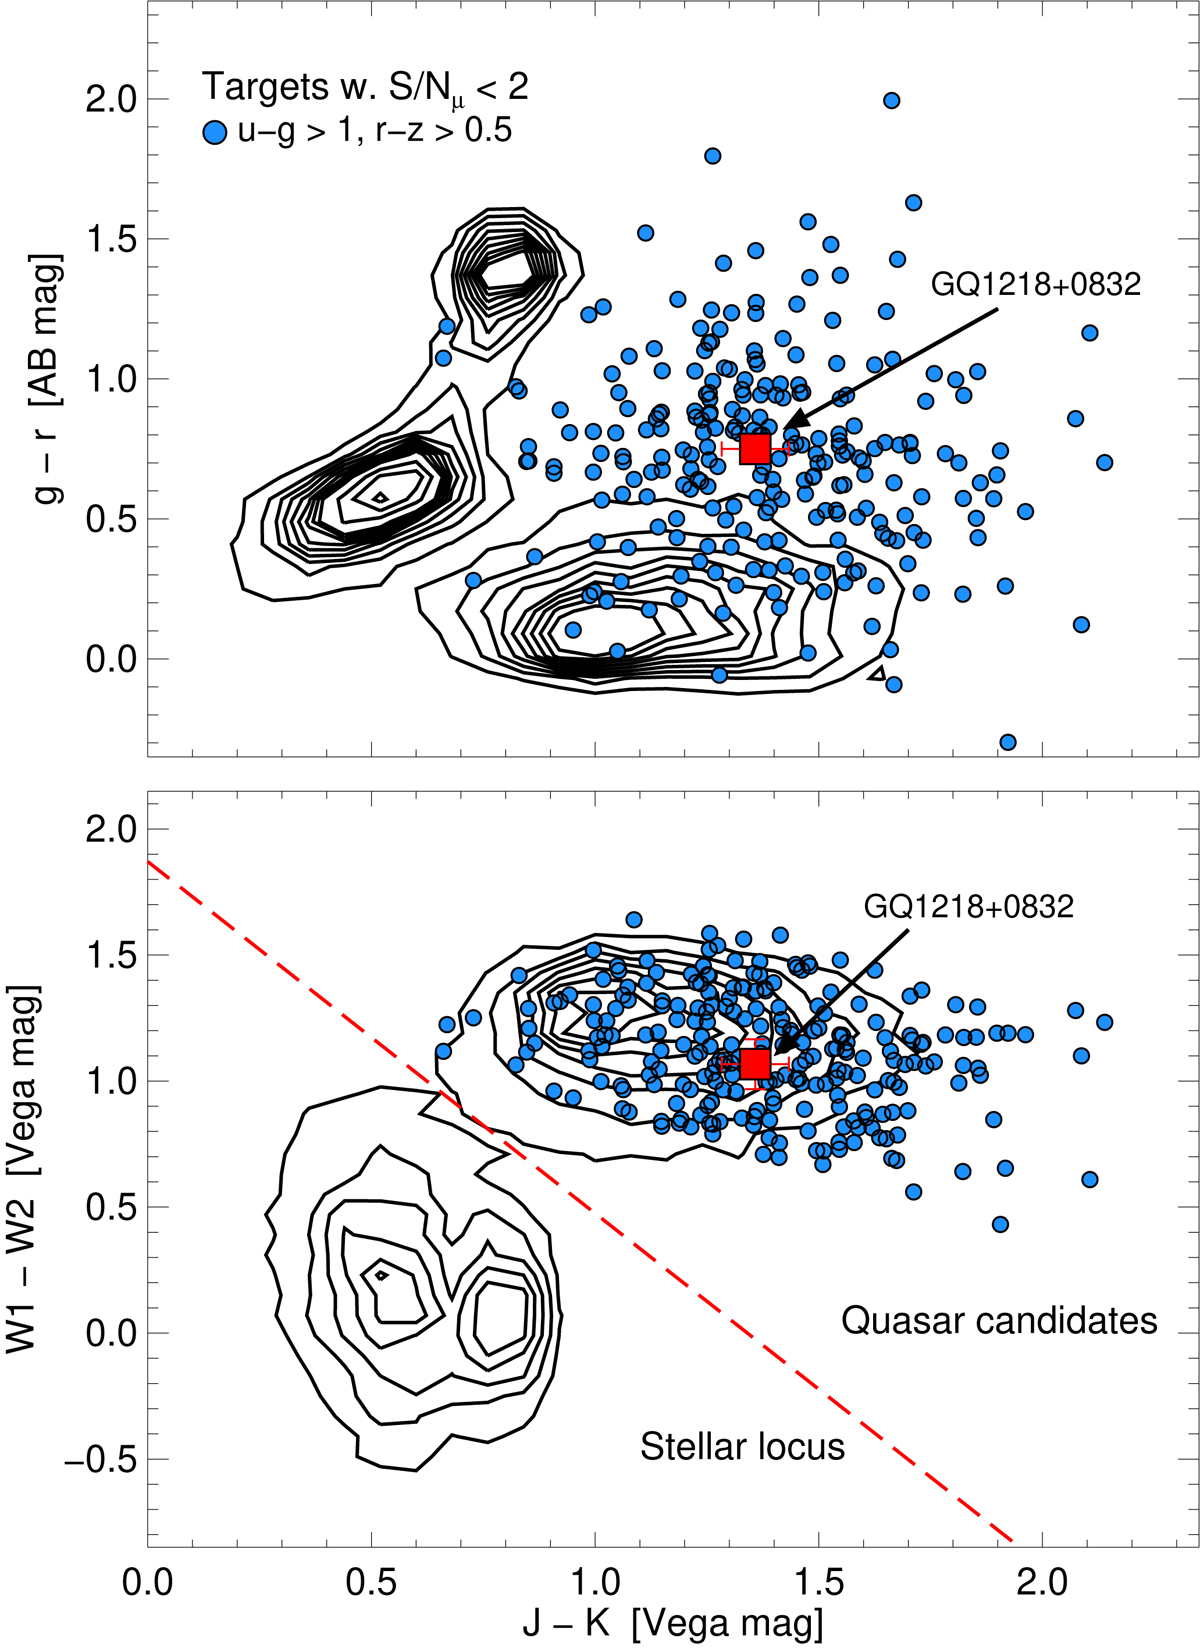
Contour plots showing the optical and near-infrared point sources at b > 60° after the imposed 2σ zero proper-motion cut. In the upper panel, we display the SDSS g − r vs. UKIDSS J − K colours, and in the bottom panel, the WISE W1 − W2 vs. UKIDSS J − K colours of the sources in the parent sample. Our near- to mid-infrared colour criterion is represented by the red dashed line. The optically red targets with u − g > 1 and r − z > 0.5 colours are displayed as blue filled circles, and GQ 1218+0832 is marked with a red square.
Current usage metrics show cumulative count of Article Views (full-text article views including HTML views, PDF and ePub downloads, according to the available data) and Abstracts Views on Vision4Press platform.
Data correspond to usage on the plateform after 2015. The current usage metrics is available 48-96 hours after online publication and is updated daily on week days.
Initial download of the metrics may take a while.