Fig. 3.
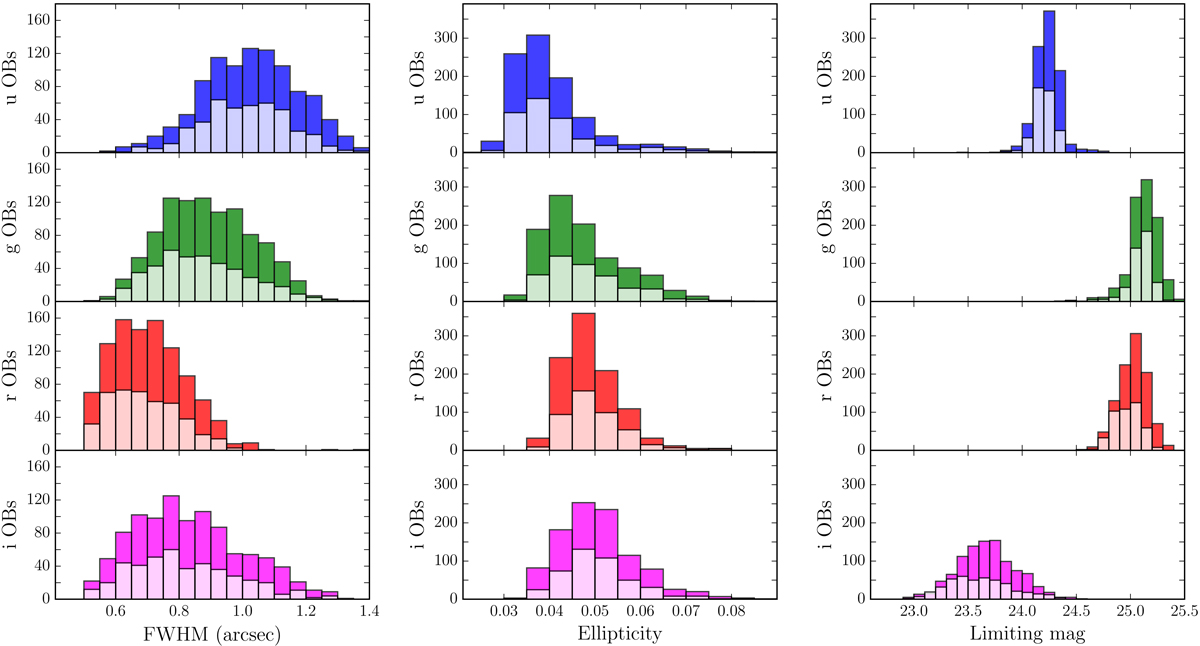
Distributions of tile-by-tile data quality parameters for the KiDS DR4 data, grouped by filter, from top to bottom u, g, r and i. The light-coloured histograms represent the subset of the data that was previously released in DR1+2+3. Left: seeing. The differences between the bands reflect the observing strategy of reserving the best-seeing dark time for r-band observations. Middle column: average PSF ellipticity ⟨|epsf|⟩, where e is defined as 1 − b/a for major/minor axis lengths a and b. Right: limiting AB magnitude (5σ in a 2″ aperture). The wider distribution of the i-band observations is a caused by variations in the moon illumination, since the i-band data were mostly taken in bright time.
Current usage metrics show cumulative count of Article Views (full-text article views including HTML views, PDF and ePub downloads, according to the available data) and Abstracts Views on Vision4Press platform.
Data correspond to usage on the plateform after 2015. The current usage metrics is available 48-96 hours after online publication and is updated daily on week days.
Initial download of the metrics may take a while.