Free Access
Fig. 22.
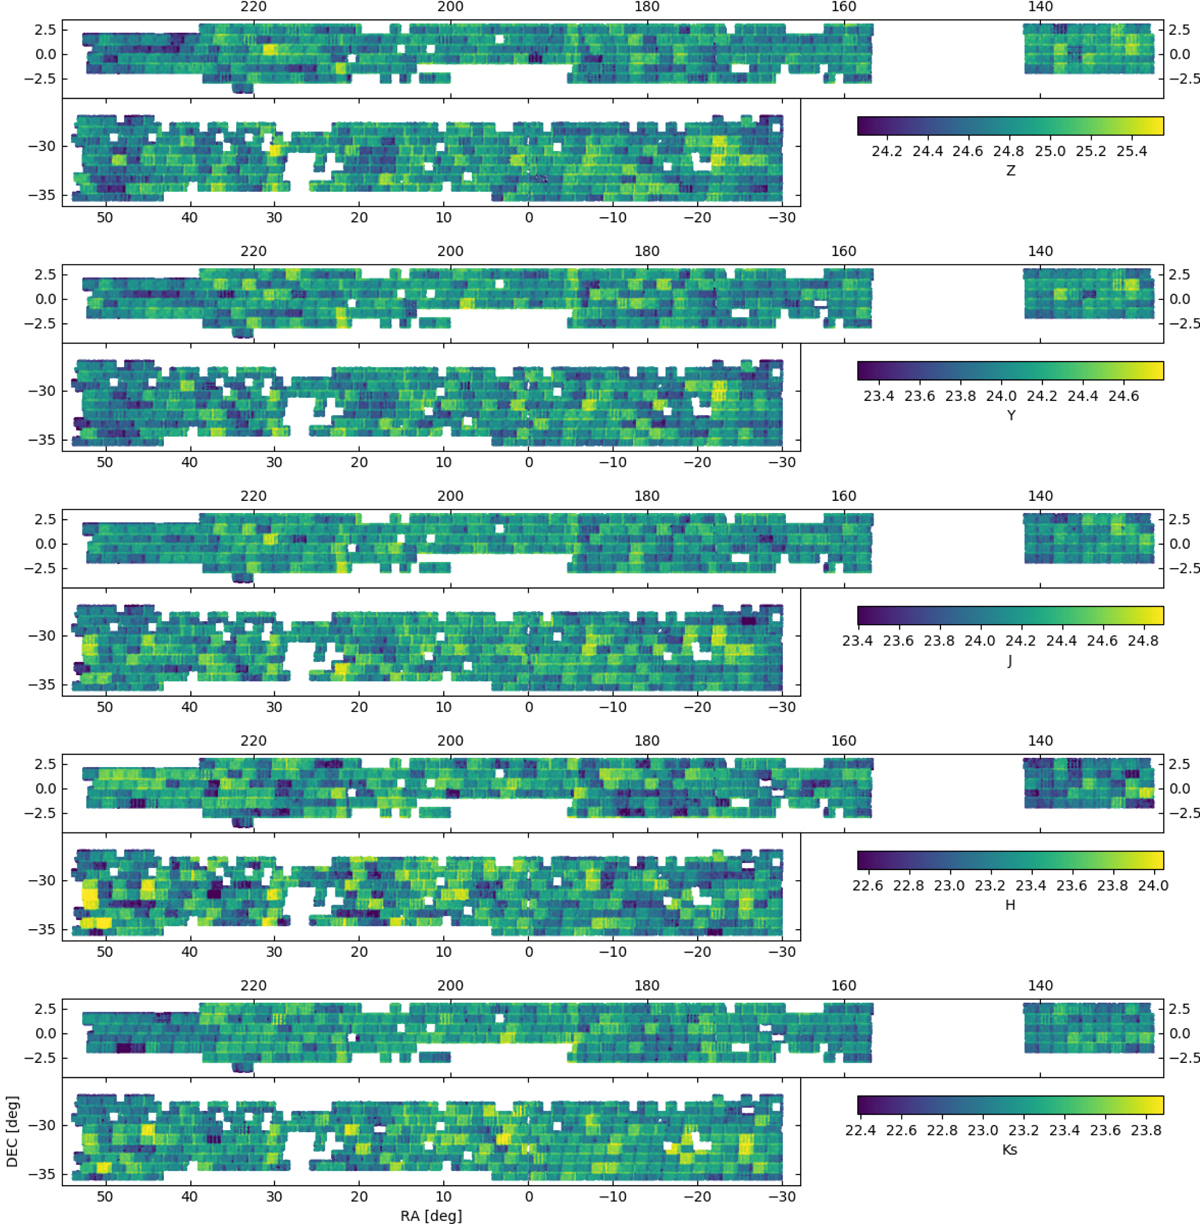
Maps of the r-band selected sources’ median limiting GAAP magnitude, corresponding to the 1σ flux error, in ![]() cells, for the five VIKING bands. Note the rectangular
cells, for the five VIKING bands. Note the rectangular ![]() patterns, due to the footprint of the VIRCAM instrument.
patterns, due to the footprint of the VIRCAM instrument.
Current usage metrics show cumulative count of Article Views (full-text article views including HTML views, PDF and ePub downloads, according to the available data) and Abstracts Views on Vision4Press platform.
Data correspond to usage on the plateform after 2015. The current usage metrics is available 48-96 hours after online publication and is updated daily on week days.
Initial download of the metrics may take a while.