Fig. 21.
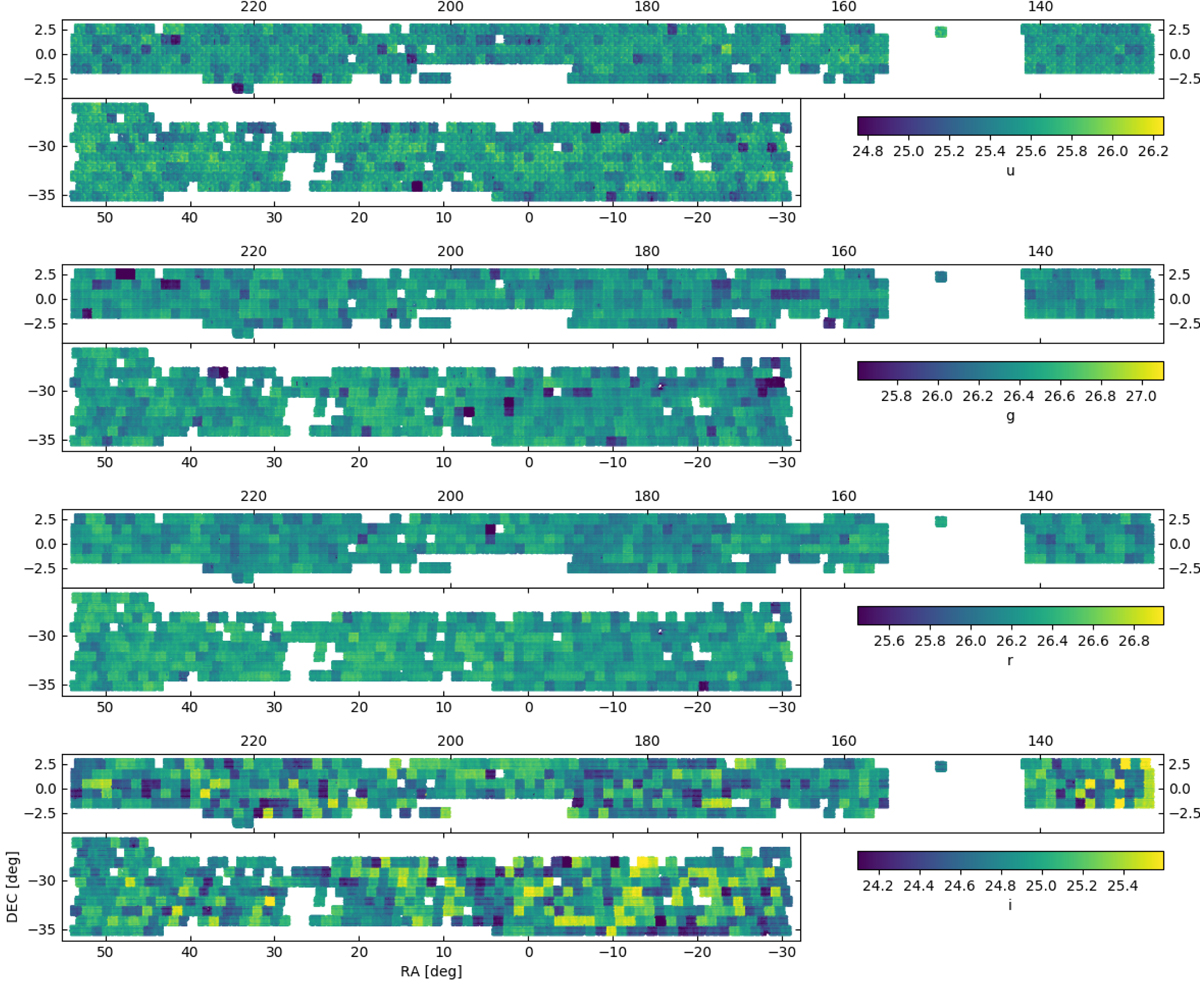
Maps of the median limiting GAAP magnitude, corresponding to the 1σ flux error, in ![]() cells, for the four KiDS filter bands. The colour scale in every map spans ±0.75 mag about the median. Note the significantly greater inhomogeneity of the i-band data: this is expected to improve in the final data release after a second pass is completed.
cells, for the four KiDS filter bands. The colour scale in every map spans ±0.75 mag about the median. Note the significantly greater inhomogeneity of the i-band data: this is expected to improve in the final data release after a second pass is completed.
Current usage metrics show cumulative count of Article Views (full-text article views including HTML views, PDF and ePub downloads, according to the available data) and Abstracts Views on Vision4Press platform.
Data correspond to usage on the plateform after 2015. The current usage metrics is available 48-96 hours after online publication and is updated daily on week days.
Initial download of the metrics may take a while.