Free Access
Fig. 18.
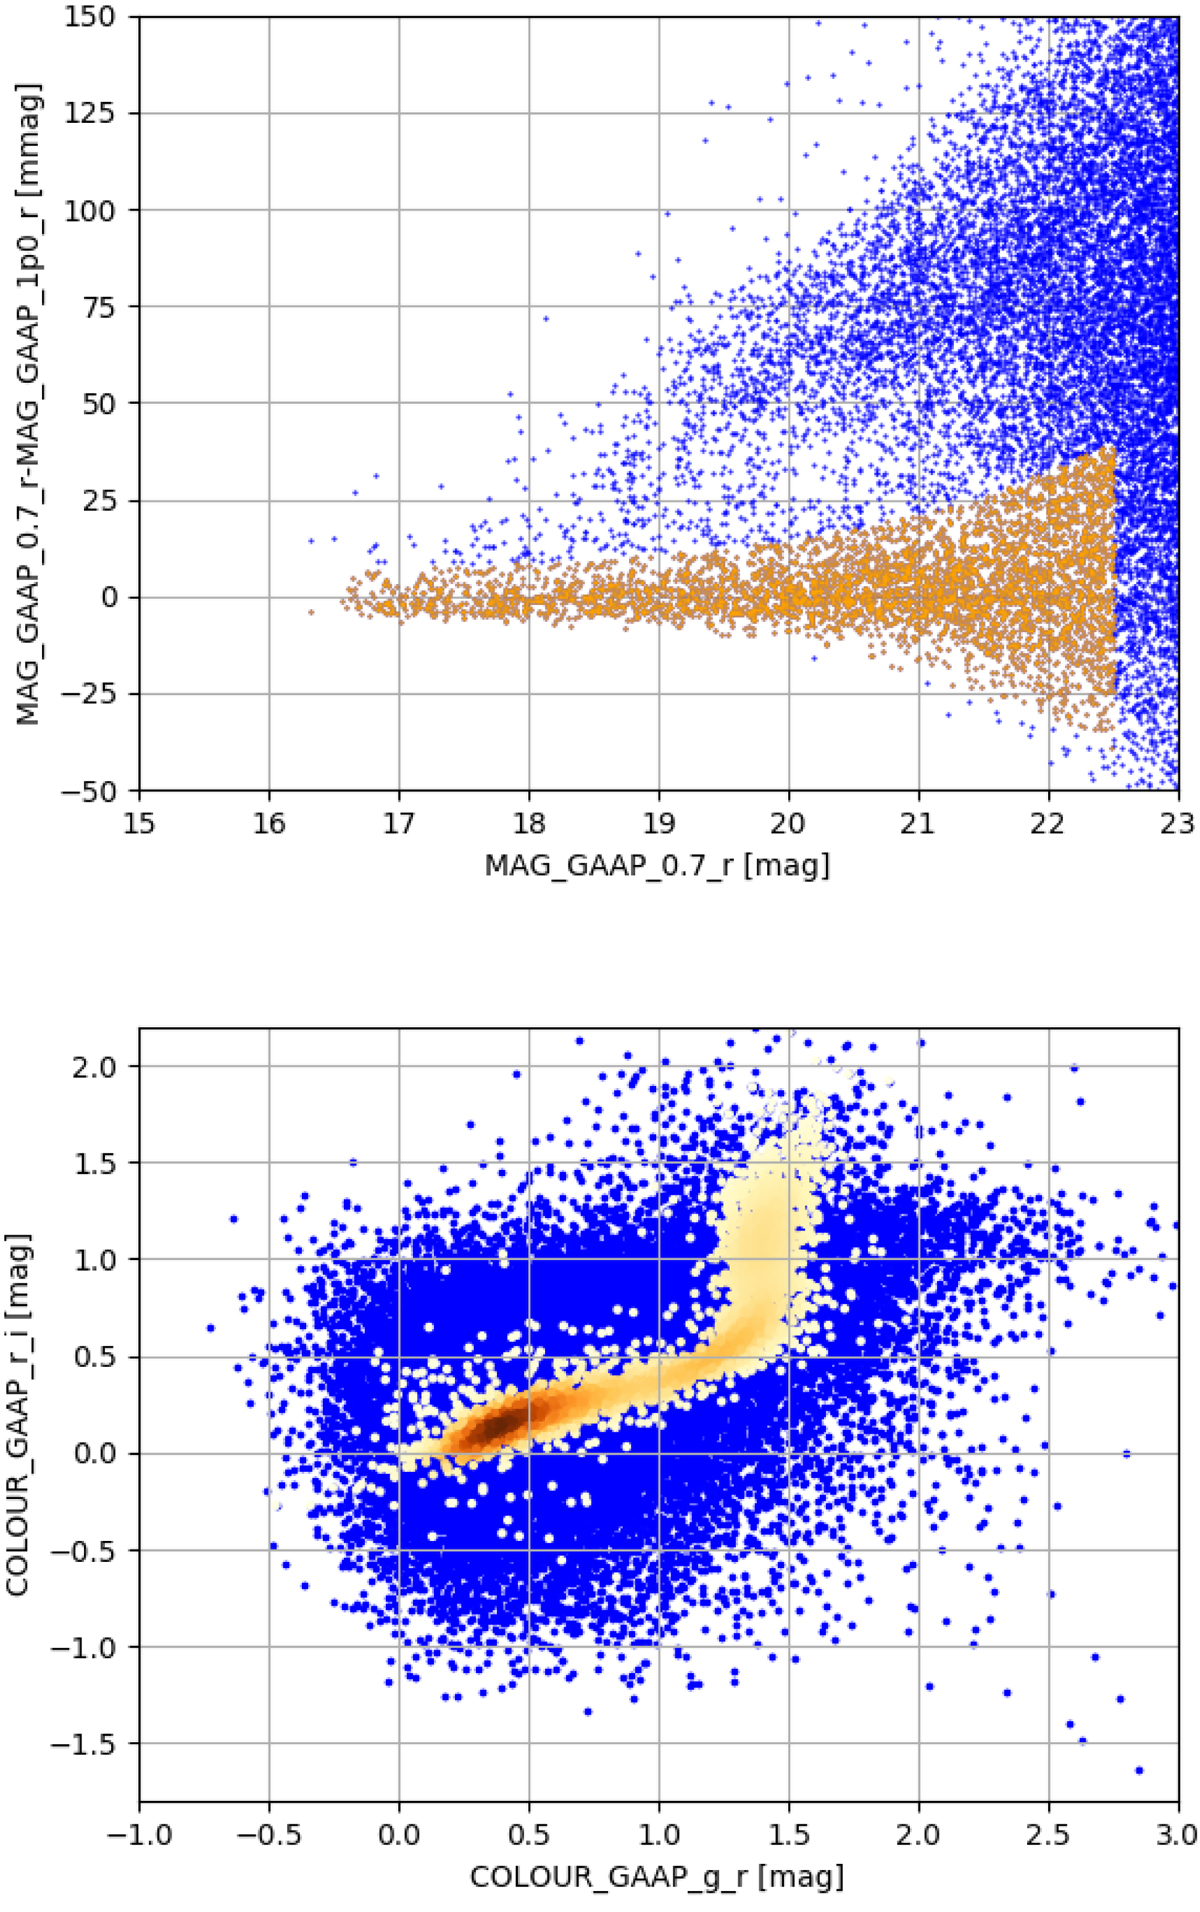
Top plot: star-galaxy separation using the 0p7 and 1p0 GAAP magnitudes. The objects shown in gold form a sequence along which both apertures yield consistent fluxes, indicating that they are unresolved. Bottom plot: g − r, r − i colour–colour diagram for the same sources, confirming that these sources are stars.
Current usage metrics show cumulative count of Article Views (full-text article views including HTML views, PDF and ePub downloads, according to the available data) and Abstracts Views on Vision4Press platform.
Data correspond to usage on the plateform after 2015. The current usage metrics is available 48-96 hours after online publication and is updated daily on week days.
Initial download of the metrics may take a while.