Fig. 3.
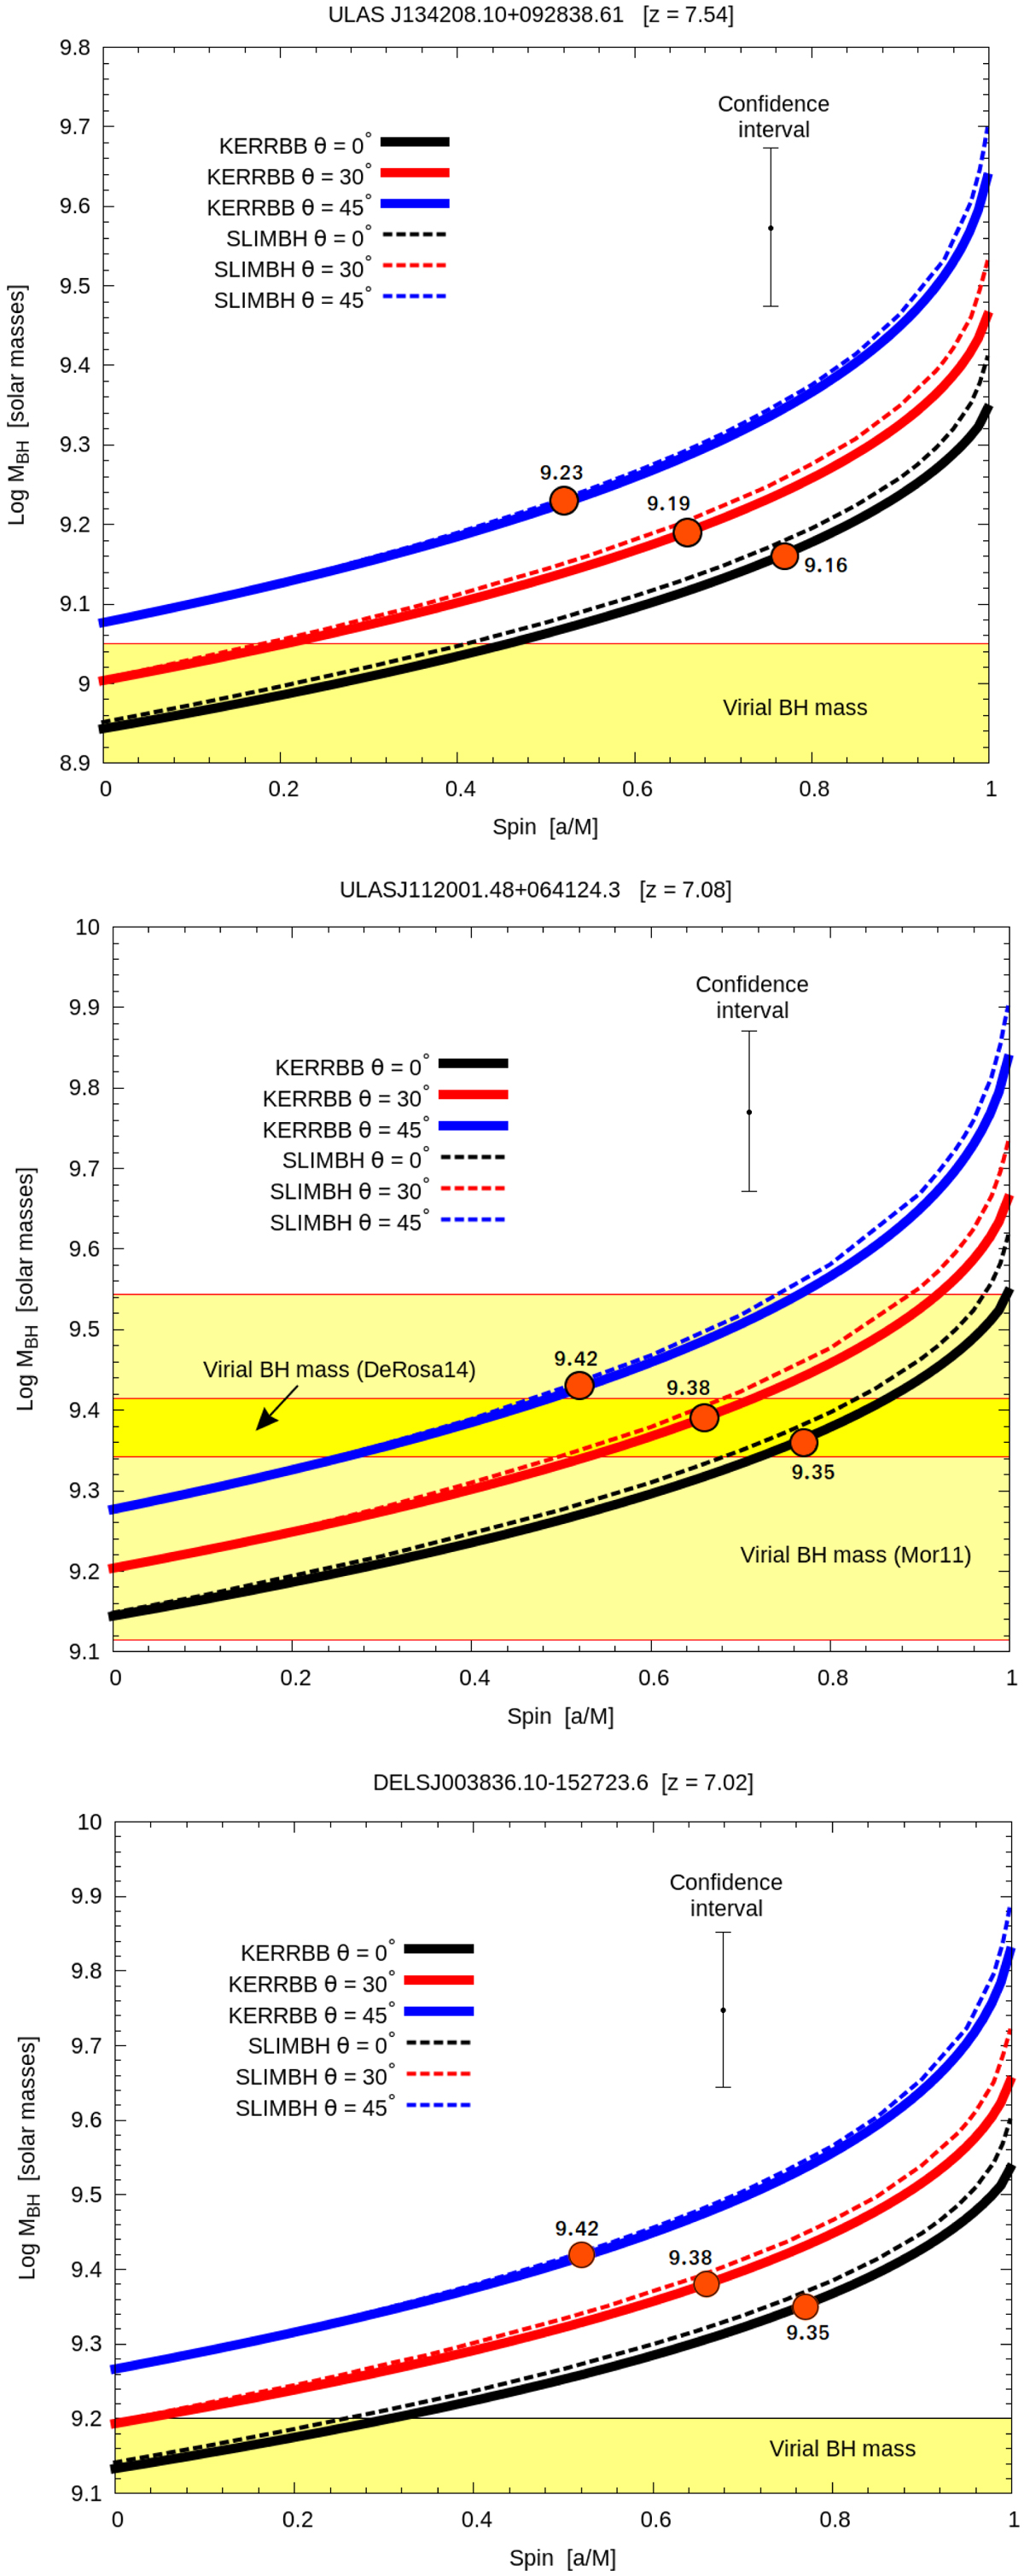
Top panel: BH mass as a function of the BH spin computed using the KERRBB and SLIMBH models (solid and dashed lines, respectively) for a fixed spectrum peak position and different viewing angles (0°, 30°, 45°) for the source J1342. The yellow area represents the virial mass range (Log ![]() ) estimated by BN18 using the MgII line. Central panel: same comparison for the source J1120. The light yellow shaded area represents the virial mass range (Log
) estimated by BN18 using the MgII line. Central panel: same comparison for the source J1120. The light yellow shaded area represents the virial mass range (Log ![]() ) estimated by MR11 using the MgII line; the dark yellow area is the virial mass range (Log
) estimated by MR11 using the MgII line; the dark yellow area is the virial mass range (Log ![]() ) estimated by De Rosa et al. (2007) using the same procedure. Bottom panel: same comparison for J0038. The yellow shaded area is the virial mass (Log
) estimated by De Rosa et al. (2007) using the same procedure. Bottom panel: same comparison for J0038. The yellow shaded area is the virial mass (Log ![]() ) estimated by W18 using the MgII line. Orange dots represent the BH mass solutions coming from the classical SS model: these correspond to particular KERRBB/SLIMBH solutions with a precise spin value. The confidence interval (±0.1 dex) is derived assuming a small uncertainty on the spectrum peak position on which the BH mass estimates are based.
) estimated by W18 using the MgII line. Orange dots represent the BH mass solutions coming from the classical SS model: these correspond to particular KERRBB/SLIMBH solutions with a precise spin value. The confidence interval (±0.1 dex) is derived assuming a small uncertainty on the spectrum peak position on which the BH mass estimates are based.
Current usage metrics show cumulative count of Article Views (full-text article views including HTML views, PDF and ePub downloads, according to the available data) and Abstracts Views on Vision4Press platform.
Data correspond to usage on the plateform after 2015. The current usage metrics is available 48-96 hours after online publication and is updated daily on week days.
Initial download of the metrics may take a while.