Fig. 2.
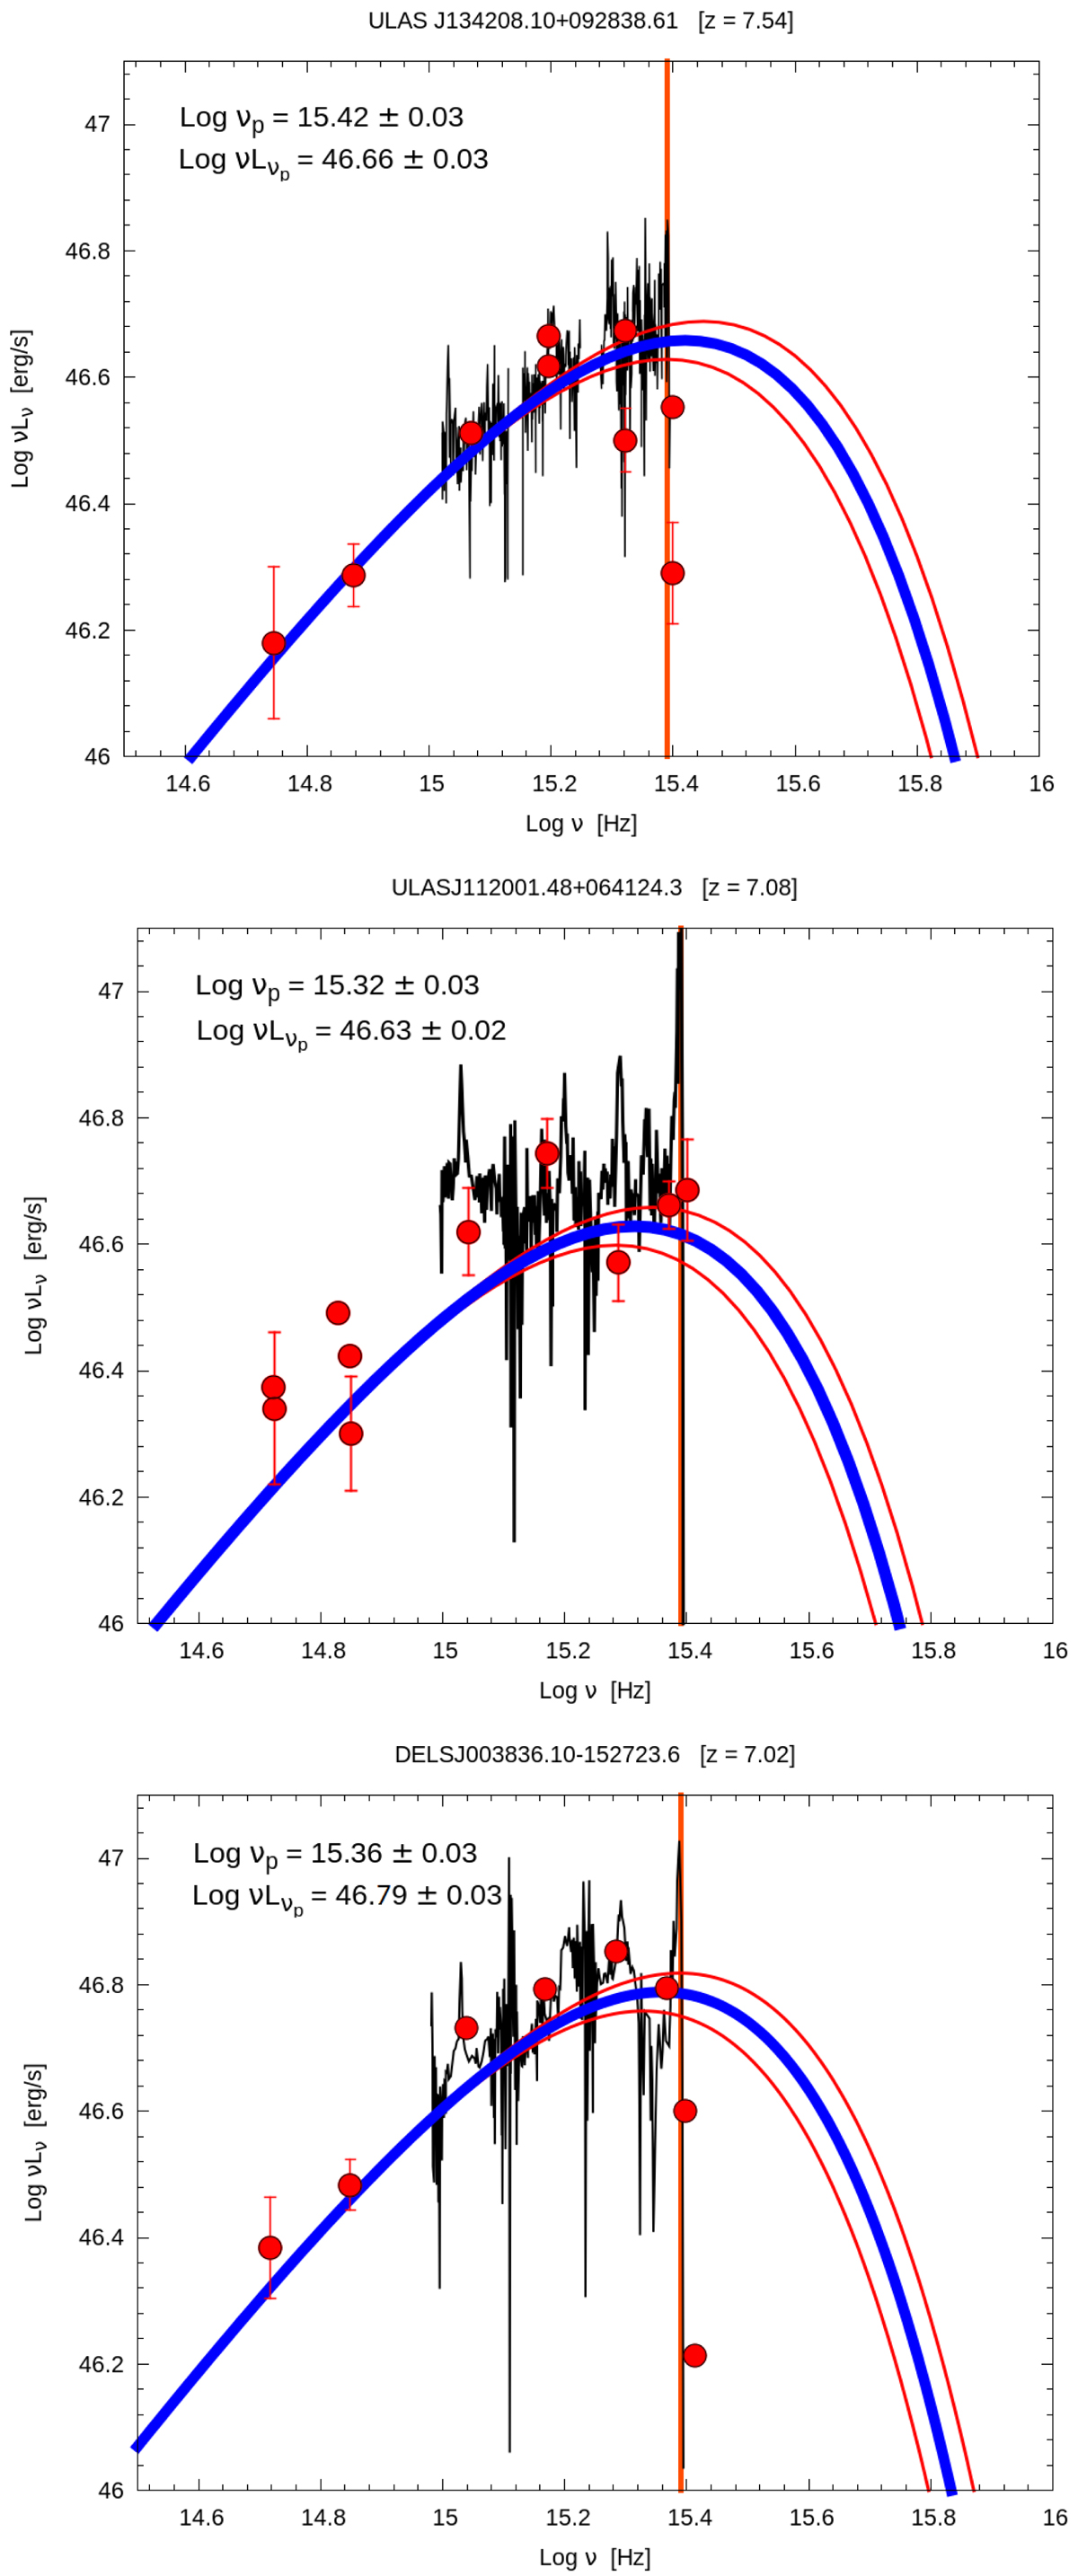
Top panel: SED of the quasar J1342 in the rest frame whose observed disk luminosity is ![]() erg s−1. Photometric data (red points) and spectrum (black line) are from Bañados et al. (2018, see this work for details regarding these data). Central panel: SED of the quasar J1120 in the rest frame with an observed disk luminosity
erg s−1. Photometric data (red points) and spectrum (black line) are from Bañados et al. (2018, see this work for details regarding these data). Central panel: SED of the quasar J1120 in the rest frame with an observed disk luminosity ![]() erg s−1. Photometric data (red points) and spectrum (black line) are from the work by Mortlock et al. (2011). Bottom panel: SED of the quasar J0038 in the rest frame with an observed disk luminosity
erg s−1. Photometric data (red points) and spectrum (black line) are from the work by Mortlock et al. (2011). Bottom panel: SED of the quasar J0038 in the rest frame with an observed disk luminosity ![]() erg s−1. Photometric data (red points) and spectrum (black line) are from the work by Wang et al. (2018). In these panels the blue curve is the “best fit” obtained using the relativistic model KERRBB. The red curves describe the confidence interval for the spectrum peak frequency and luminosity from the model. The vertical orange line indicates the Lyα line frequency: at frequencies larger than this latter, data are strongly affected by intervening Lyα clouds along our line of sight and therefore we did not include these data in our fit.
erg s−1. Photometric data (red points) and spectrum (black line) are from the work by Wang et al. (2018). In these panels the blue curve is the “best fit” obtained using the relativistic model KERRBB. The red curves describe the confidence interval for the spectrum peak frequency and luminosity from the model. The vertical orange line indicates the Lyα line frequency: at frequencies larger than this latter, data are strongly affected by intervening Lyα clouds along our line of sight and therefore we did not include these data in our fit.
Current usage metrics show cumulative count of Article Views (full-text article views including HTML views, PDF and ePub downloads, according to the available data) and Abstracts Views on Vision4Press platform.
Data correspond to usage on the plateform after 2015. The current usage metrics is available 48-96 hours after online publication and is updated daily on week days.
Initial download of the metrics may take a while.