Fig. 1.
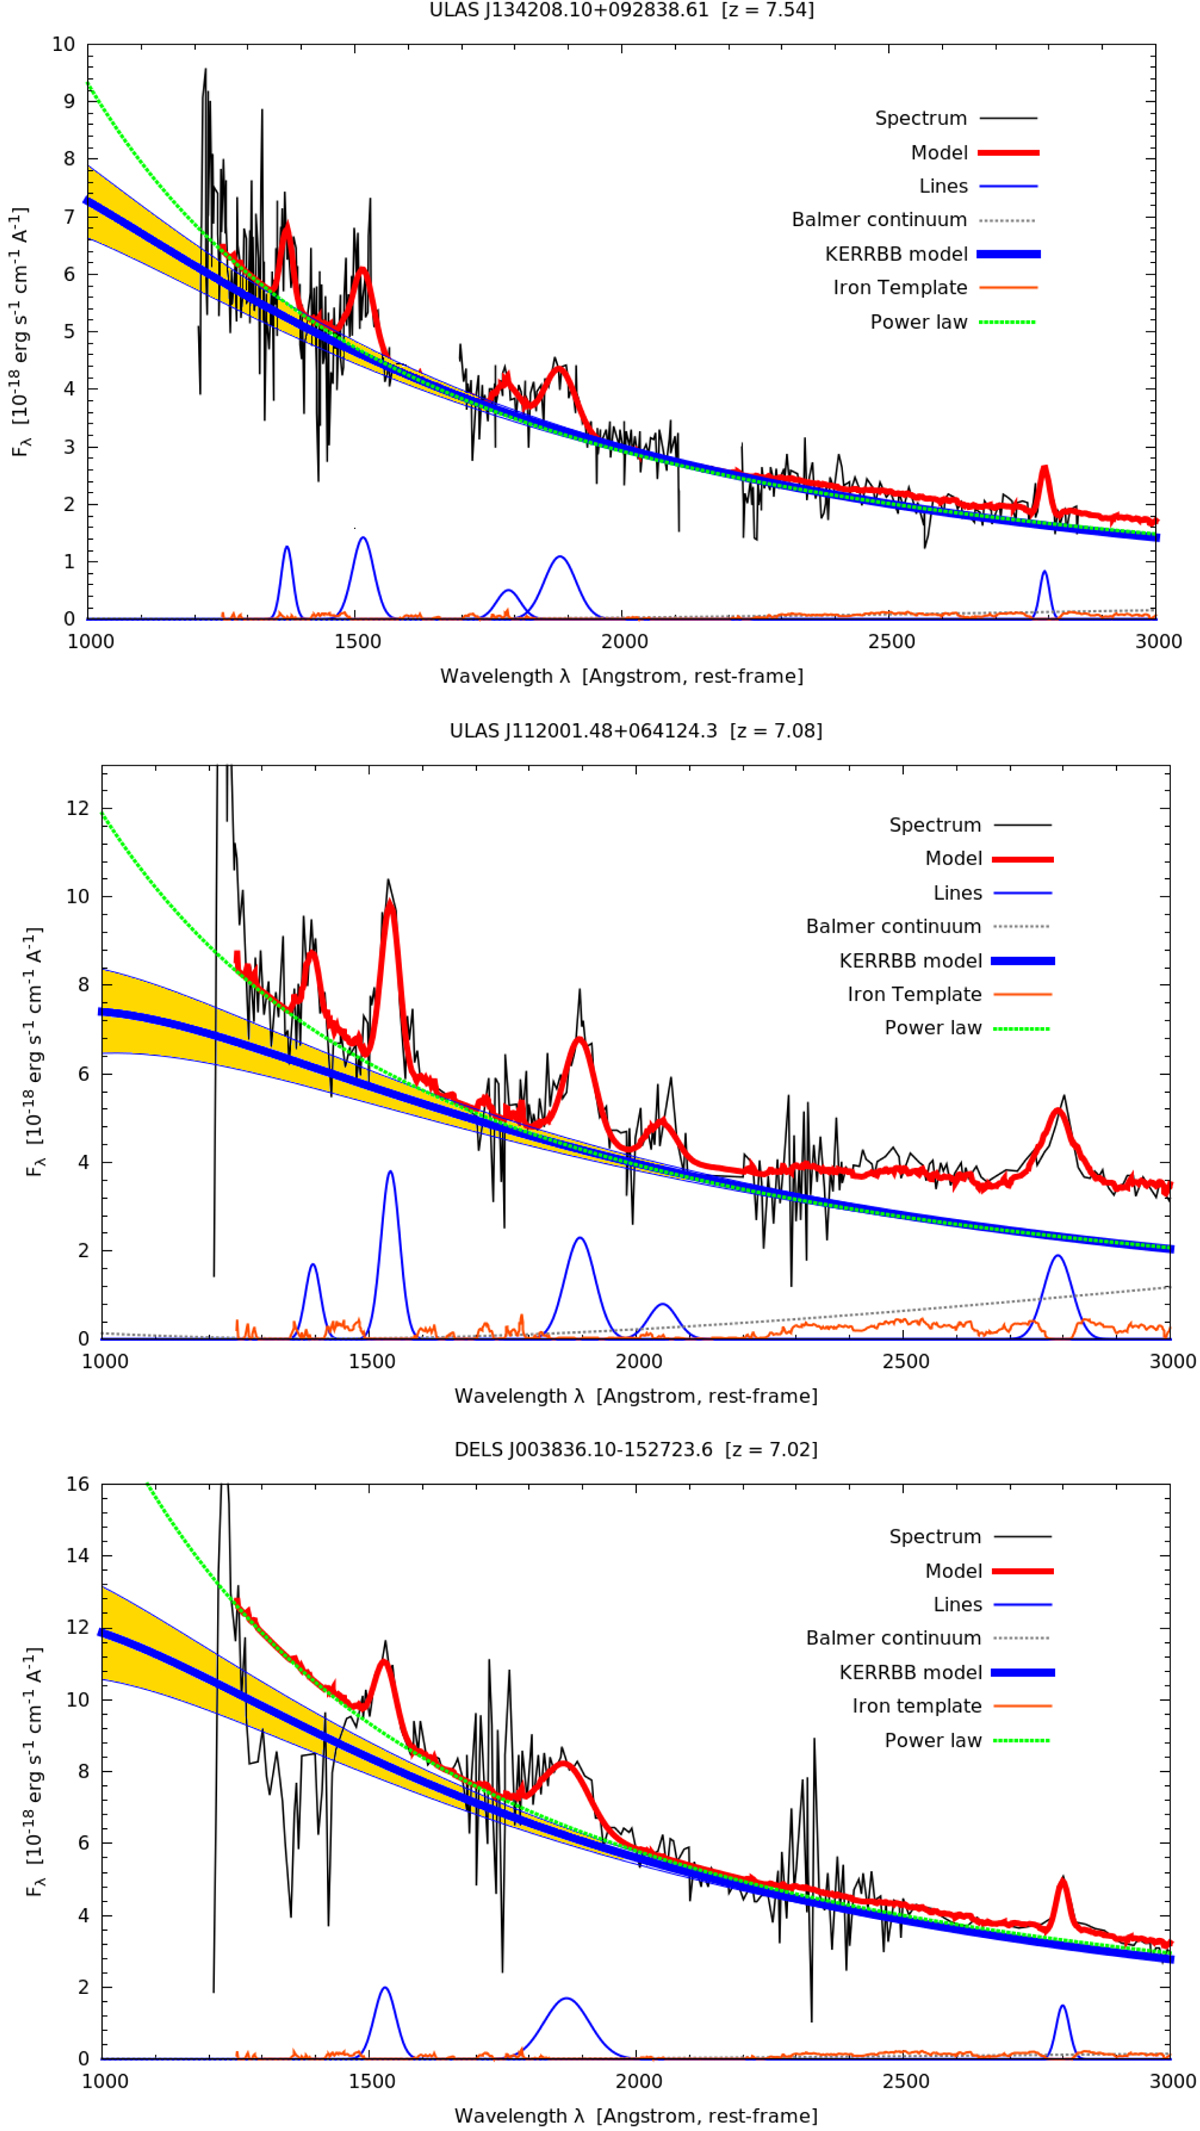
Spectrum fit of the three sources as a power-law continuum (dotted green line) plus the iron complex (orange line), the Balmer continuum (dotted gray line) and some prominent emission lines (thin blue line) like MgII, CIII, CIV and SiIV. The red line is the model of the spectrum given by the sum of all these components. The thick blue line is the KERRBB model of the continuum for which we defined a confidence interval (yellow area): the model overlaps well the power law for λ > 1700 Å (the difference at shorter wavelengths is due to the fact that the accretion disk model is not a power law around the spectral peak). Regions between the J − H and H − Ks bands are affected by low sky transparencies (these regions are not shown in the J1342 spectrum – BN18; for the other two sources they are visible as very noisy features): for this reason we did not include them in the fitting procedure.
Current usage metrics show cumulative count of Article Views (full-text article views including HTML views, PDF and ePub downloads, according to the available data) and Abstracts Views on Vision4Press platform.
Data correspond to usage on the plateform after 2015. The current usage metrics is available 48-96 hours after online publication and is updated daily on week days.
Initial download of the metrics may take a while.