| Issue |
A&A
Volume 624, April 2019
|
|
|---|---|---|
| Article Number | L5 | |
| Number of page(s) | 10 | |
| Section | Letters to the Editor | |
| DOI | https://doi.org/10.1051/0004-6361/201935267 | |
| Published online | 09 April 2019 | |
Letter to the Editor
The complexity of Orion: an ALMA view
III. The explosion impact⋆
1
LERMA & UMR8112 du CNRS, Observatoire de Paris, PSL University, Sorbonne Universités, CNRS, 75014 Paris, France
e-mail: This email address is being protected from spambots. You need JavaScript enabled to view it.
2
Department of Astronomy, University of Michigan, 311 West Hall, 1085 S. University Ave, Ann Arbor, MI 48109, USA
3
JPL, Pasadena, CA, USA
4
Harvard-Smithsonian Center for Astrophysics, Cambridge, MA, USA
5
Department of Astronomy, University of Massachusetts, Amherst, MA 01003, USA
6
Univ. Grenoble Alpes, CNRS, IPAG, 38000 Grenoble, France
Received:
14
February
2019
Accepted:
16
March
2019
Abstract
The chemistry of complex organic molecules in interstellar dark clouds is still highly uncertain in part because of the lack of constraining observations. Orion is the closest massive star-forming region, and observations making use of ALMA allow us to separate the emission regions of various complex organic molecules (COMs) in both velocity and space. Orion also benefits from an exceptional situation, in that it is the site of a powerful explosive event that occurred ∼550 years ago. We show that the closely surrounding Kleinmann-Low region has clearly been influenced by this explosion; some molecular species have been pushed away from the densest parts while others have remained in close proximity. This dynamical segregation reveals the time dependence of the chemistry and, therefore allows us to better constrain the formation sequence of COMs and other species, including deuterated molecules.
Key words: astrochemistry / ISM: kinematics and dynamics / ISM: clouds / evolution / ISM: molecules / ISM: individual objects: Orion KL
This paper makes use of the following ALMA data: ADS/JAO.ALMA#2013.1.00533.S. ALMA is a partnership of ESO (representing its member states), NSF (USA) and NINS (Japan), together with NRC (Canada), NSC and ASIAA (Taiwan), and KASI (Republic of Korea), in cooperation with the Republic of Chile. The Joint ALMA Observatory is operated by ESO, AUI/NRAO and NAOJ.
© L. Pagani et al. 2019
 Open Access article, published by EDP Sciences, under the terms of the Creative Commons Attribution License (http://creativecommons.org/licenses/by/4.0), which permits unrestricted use, distribution, and reproduction in any medium, provided the original work is properly cited.
1. Introduction
Though Orion is a well-studied region and has been explored with a wide variety of instruments, including the NOEMA (former Plateau de Bure) Interferometer, the Berkeley-Illinois-Millimeter-Array (BIMA), the Combined Array for Research in Millimeter-wave Astronomy (CARMA), and the Submillimeter Array (SMA), the arrival of the Atacama Large Millimeter Array (ALMA) holds the promise of new discoveries thanks to its higher angular resolution and sensitivity. The ALMA instrument provides high-velocity resolution while maintaining a high dynamic range that enables the detection of previously unseen structures, leading to a better understanding of the source structure and evolution.
Based on the search for the lowest observable rotational transition of 16O18O at 234 GHz, we performed deep observations of this source during Cycle 2 with 37–39 antennas, surveying 16 GHz in ALMA band 6, and improving the sensitivity by a factor ∼5 compared to the Cycle 0 Science Verification (SV0) observations for the frequencies in common (Pagani et al. 2017, hereafter Paper I). Paper I presents a more detailed history of the recent work on Orion. In Paper I, we present the data and first results including the detection of several species not previously seen in Orion (n– and i–propyl cyanide, C3H7CN, ...) as well as several vibrationally excited levels of cyanoacetylene (HC3N) and of its 13C isotopologues. A companion paper (Favre et al. 2017) presents the first detection of gGg′ ethylene glycol (gGg′ (CH2OH)2) and of acetic acid (CH3COOH1) in Orion.
One remarkable feature present in the central region of Orion is an explosive event that occurred 550 ± 25 years ago (J. Bally, priv. comm.) and was revealed by the three runaway stars BN, n, and I (Gómez et al. 2005; Rodríguez et al. 2005, 2017), and by the CO and H2 fingers (e.g., Allen & Burton 1993; Zapata et al. 2009; Nissen et al. 2012; Youngblood et al. 2016; Bally et al. 2017). However, Luhman et al. (2017) showed that the object n is no longer a runaway member because its real proper motion is much lower than previously estimated; but conversely another object, named x, is moving away at high speed from the same explosion center. J. Bally (priv. comm.) confirms the fast proper motion of x and the absence of movement of n from ground-based H2 images 14 years apart. X is further out having passed our 20% beam coupling mark (see Fig. 1 of Paper I), and therefore does not appear in the figures presented in this Letter. Zapata et al. (2011) and Orozco-Aguilera et al. (2017) in their follow-up work with ALMA proposed that the hot core (HC) is externally heated despite its high temperature, and that the heating source could be the nearby explosion. Similarly, Blake et al. (1987), Wang et al. (2011), and Favre et al. (2011) advocated that the Compact Ridge is also externally heated, although the heating source should not be the same since we presented evidence in Paper I that the Compact Ridge has not yet been affected by the impact of the explosion. A possibility could be the outflow from source I hitting the Compact Ridge (Liu et al. 2002). In Paper I, we also presented evidence for an interaction between the explosive event and the main components of the Orion KL region including the HC, several infrared (IR) components (Rieke et al. 1973), and methyl formate (CH3OCHO; hereafter MF) peaks (Favre et al. 2011). We showed that the IRc6/MF5 and IRc20/MF4 sources, west of the explosion center, display emission lines of various species having only red wings, while sources on the east and south sides display emission lines having only blue wings. We also confirmed that excited emission lines are found preferentially surrounding the explosion center and that complex organic molecules (COMs) rich in oxygen (O-COMs) do not occupy the same volumes as CN rich COMs (CN-COMs). We identified the ethylene glycol peak (EGP) to be coincident with a hollow sphere of material, which we interpreted to have originated from the impact of a “bullet” launched from the explosion center (Favre et al. 2017; Wright & Plambeck 2017). We also proposed that the Compact Ridge (MF1) is sufficiently far away from the rest of the KL region to have not yet been perturbed by the explosion, the evidence being the absence of asymmetric emission line wings and the narrowness of the lines themselves (∼1 km s−1). In this Letter, we study further the interaction of the explosion blowout with the surrounding gas and dense sources.
2. Observations
The observations have been described in detail in Paper I, and we give here only a short summary. Observations were carried out in December 2014, during the Cycle 2 period, with 37 antennas, and 39 antennas for the last run. Sixteen GHz of discontinuous bandwidth were covered in the frequency range 215–252 GHz. One band, centered on 16O18O at 234 GHz, was observed all the time (2.5 h), reaching a sensitivity of ∼2 mJy beam−1 while the other bands were observed only in one setup each (30 min duration), with 488 kHz channel spacing and reaching a typical noise of 5 mJy beam−1 (see Table 1 in Paper I). As in Paper I, the part of the data discussed in this work are centered on RAJ2000: 05h35m14.160s, DecJ2000: −05°22′31.504″. Since we do not yet have total power observations to include to the data set, this paper concentrates on the kinematics and spatial positioning of the sources rather than on discussions of column density.
3. Channel maps
It is interesting to examine channel maps rather than integrated intensity maps when the signal is strong enough. Figures 1 and 2 show a selection of channels for H2CO (JKK′:918–919, at 216568.651 MHz) and H2CNH (JKK′:716–707, at 250161.775 MHz), respectively. For all channel maps, the white contours represent 10 to 90% of the peak emission of the strongest channel for that species (which may not be one of the displayed channels) in steps of 10%. This allows us to estimate the importance of the emission at the given velocity. These two species were chosen to be representative of two types of molecules: those showing evidence of a strong interaction with the wind of the explosion and those that do not. The first category is illustrated by H2CO, the channel maps of which show elongations that can be traced back to the 550-year-old explosion center as suggested by the yellow arrows (Fig. 1). Not only do the lowest contours form convex structures oriented away from the explosion center but the peak emission is always displaced outward with respect to the local continuum peaks. The offset is especially strong southeastward in the 9 and 10 km s−1 channel maps where the maximum emission from MF6 and the EGP is clearly displaced (sources are labeled in Fig. 1 of Paper I and in Fig. A.1). There is also a northwest elongation past MF5 between 7 and −8 km s−1. This feature is also clearly seen in OCS and D2CO, and in other species such as NO but at a much lower intensity level (∼0.15 Jy beam−1 for NO). Similarly, the emission is neatly stretching away from the IRc7 spot at velocities 3–6 km s−1. The elongated emission north of the HC east from the explosion center, typically at 0 to 3 km s−1, is seen (Fig. B.1) in all species that are emitting strongly enough in that velocity range.
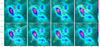 |
Fig. 1. Selection of formaldehyde (H2CO, JKK′:918–919, at 216568.651 MHz) channel maps (δV = 0.68 km s−1). The top left corner indicates the channel velocity, the species, and its upper energy level. White contours are at 10 to 90% of the peak emission of the strongest channel for that species. Yellow arrows starting from the explosion center (red eight-pointed star) suggest possible displacement of gas linked to the explosive event, which occurred 550 ± 25 years ago. Five-pointed stars denote the position of the 10 sources studied in Paper I (Fig. 1, see also Fig. A.1 here). Underlying color map (enhanced by black contours) in this and subsequent figures is the 1.2 mm continuum emission (Paper I). |
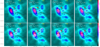 |
Fig. 2. Same as Fig. 1 for a selection of methanimine (H2CNH, JKK′:716–707, at 250161.775 MHz) channel maps (δV = 0.59 km s−1). |
Spatial velocity cuts along the two most prominent northeast and southwest features of the H2CO maps reveal essentially constant velocity (< 1 km s−1 shift) over their ∼5–10″ (0.01–0.02 pc) extent. The dynamical time of these features cannot be inferred from their line-of-sight velocity since these movements are close to the plane of the sky with relative velocities of only one to a few km s−1. Conversely, the longest H2CO elongation, ∼10″ can be attained in 550 years if the gas is moving at ∼40 km s−1. This is much lower than the maximum 12CO clump velocities noticed in various data sets including our own, on the order of 140 km s−1 (Zapata et al. 2009; Bally et al. 2017).
It is remarkable that a number of species do not show these various elongations (except that at ∼2 km s−1) and remain close to the dust emission peaks. This is the case of the H2CNH shown (Fig. 2) but also of, for example, CH3OCH3, CH3OCHO, NH2CHO, and NH2D. A few others, like ethyl cyanide and vinyl cyanide, show only limited displacements. We do not see any elongations related to the BN, I, and x runaway stars either. This probably indicates that the stars are moving independently of the gas.
In Figs. B.1–B.3, we compare all species that are strong enough to be plotted channel-wise, at three representative velocities of 2.5, 7.5, and 9.0 km s−1. The white contours have the same identification as in Figs. 1 and 2. We did not include species such as CO, SO, and SO2 that extend beyond the BN-KL region and for which zero-spacing data are missing to the point that the line profiles are totally distorted. We allowed three exceptions: methanol, for which we selected a relatively high upper energy level transition (Eup/k = 231 K) to keep its spatial extent within the limits of efficient primary beam coupling; and H2CO and OCS, which are mildly distorted but still provide information on the small scale components in the KL region. At 2.5 km s−1, the D2CO and NH2D maps are missing owing to line blending. Depending on the species, the elongations are present or not and when absent, the peak emission is generally centered on the infrared peaks or at least along the continuum ridges. In a few cases, and mostly around the IRc7 peak, the local maximum emission is on the inner side of the infrared peak, i.e., displaced toward the explosion center while the extended emission on the other edge of the continuum peak is still present. This is the case for CH3COCH3, CH3NCO, c-C2H4O, D2CO, and without extension for NH2D and H2CNH, at ∼7.5 and ∼9 km s−1 (Figs. B.2 and B.3).
4. Discussion
From Figs. 1, 2, and B.1–B.3, we see clear evidence for the effect of the explosion in many species. This was already mentioned in Paper I, in which we revealed the existence of blue wings for the sources east and south of the explosion center and of only red wings for the western sources (MF4 and MF5). We also showed that systemic velocities are below 7 km s−1 for the eastern sources and above 7 km s−1 for the western sources. We explained these features in terms of the sources expanding away from the explosion center. In this picture the eastern sources are in front of the center and the western sources are behind (Fig. 30 of Paper I). The asymmetrical wings were explained as gas being accelerated by the explosion blowout. Wright & Plambeck (2017) and ourselves (Favre et al. 2017) also presented evidence for a bullet having hit the dense ridge near MF6. This bullet was most probably launched by the explosion. That the HC has no internal source and is heated from outside, most probably by the explosion, has been advocated by Zapata et al. (2011) and Orozco-Aguilera et al. (2017). This is particularly obvious when 12 μm maps of the region are superimposed (Greenhill et al. 2004; Robberto et al. 2005) on our 1.2 mm continuum map (see Fig. A.1). The IRc2 spot marked by Greenhill et al. (2004) is halfway between the explosion center and the HC while the latter is invisible at 12 μm.
With the channel maps, we see some direct evidence of the fast expansion as many species are being driven away from the explosion center at the same velocities: from −2 to 3 km s−1 eastward, through MF10; from 6 to 11 km s−1 southeastward through MF6; from 6 to 9 km s−1 northwestward through MF5; from 7 to 14 km s−1 in between MF4 and MF5 and then through MF4 (especially visible in H2CO, D2CO, and OCS, Fig. B.2); and from 2 to 6 (or 8 depending on the species) km s−1 southward through IRc7. These offsets are due to the winds from the explosion center that pass near the dense dust cores, collect the molecules recently released from the grains, and push these molecules away. The different velocities possibly reflect the direction of propagation if we suppose the winds to be spherically expanding. For example, the long southeast extension crossing MF6 probably passes behind the dust ridge since its velocity range (from 6 to 11 km s−1) is globally higher than the HC-MF6 range (4–6 km s−1). In summary, we see that some molecular species show emission elongated to significant distances all pointing away from the explosion center, while other species do not. A number of these species are predominantly formed on grain surfaces, and these channel maps may be understood as due to the evolution of these species after they are released from the dust grains and are driven outward by the explosion. Those molecules that do not show elongations, such as H2CNH and NH2D, are probably rapidly destroyed after their release in the gas phase. In the case of NH2D, the tentative detection of NH3D+ by Cernicharo et al. (2013), later confirmed by laboratory measurements of Stoffels et al. (2016), could suggest an explanation. NH2D can react with  to form NH3D+ in two-thirds of the cases, and NH4+ + HD in one-third of the cases. Although the probability of dissociative recombination of NH3D+ to form NH3 is statistically three times less probable than the formation of NH2D, the rapid destruction of NH2D is still expected since 50% of the reactions with
  eventually lead to NH3 and in this warm environment (100–300 K), deuteration is not expected to occur in the gas phase to replenish NH2D. Similarly, D2CO extends away from the explosion center but less than H2CO. D2CO is converted back to HDCO and next to H2CO by repeated reactions with
  , followed by dissociative recombinations. To test this idea, we ran our gas-phase chemical model including our deuteration network with the spin states of H2 and
  isotopologues (Pagani et al. 2011). Starting from a gas rich in deuterated species (D2CO/H2CO ≈ 0.01 and NH2D/NH3 ≈ 0.3) at a density of 1 × 105 cm−3, a temperature of 150 K, low extinction to the ISRF and a harsh environment (approximated by a cosmic ionization rate ζ of 1 × 10⁻¹⁵ s−1), we found that the D2CO/H2CO ratio drops by a factor of 3 to 40 in 500 to 1000 years, the abundance of D2CO itself drops by a factor 3 to 100 in the same time, while the NH2D/NH3 ratio drops by a factor 6 to 200 in 500 years, and the abundance of NH2D itself decreases by a factor 20 to 5000 (Fig. 3). The decrease of NH2D is much more rapid than the decrease of D2CO, which is illustrated by the fact that NH2D does not expand at all away from the icy dust evaporation sites, unlike D2CO. It would be interesting to map H2COH+ (2 and 3 mm transitions of this ion have been detected in a number of sources, including Orion KL; Ohishi et al. 1996) and NH3D+ in the source at a similar resolution and make quantitative statements about the abundance of each species in each velocity channel, but this is beyond the scope of this Letter.
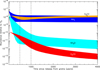 |
Fig. 3. Abundance variation with time of deuterated species following their release from grains. The range of values covers a factor of 10 in UV illumination variation. Vertical dashed lines indicate 500 and 1000 years. |
Species such as ethyl cyanide and vinyl cyanide are only slightly displaced outward. They probably survive longer than NH2D or H2CNH before being destroyed or converted to other species.
It seems therefore that the closeness of Orion, combined with the ongoing expansion and availability of high spatial resolution observations opens a new window on the time evolution of different species soon after their release in the gas phase in a way similar to a time-of-flight experiment. This will allow us to select the important chemical paths between species and possibly constrain the chemistry of COMs. Recently, Tercero et al. (2018) have suggested segregation of various O-bearing COMs based on spatial variation inside BN-KL. Including the channel information presented in this work, combined with quantitative estimates, which require the inclusion of zero-spacing data that is not yet available, will allow us to follow the abundance variations of each species along the expanding paths and better understand the chemistry in hot cores, both in the gas phase and on grain surfaces.
5. Conclusions
We show that thanks to the high quality of the ALMA data (large signal/noise ratio, good sampling of the UV plane), we can study channel by channel the fate of numerous molecules, and separate the components both spatially and in velocity. The expansion of each molecular species due to the 550-year-old explosion is comparable to a time-of-flight experiment and allows us to put constraints on the way the chemistry proceeds in the cloud. This is an exceptional situation not met in other sources in which all species are mixed spatially and therefore their temporal evolution cannot be discerned. Hence, Orion KL should be the prime benchmark for chemical models to treat the formation and evolution of COMs in hot cores. To quantify these constraints, zero-spacing data should be added to the present set and other species (DCO+, DNC, HNC, HCO+, NH3D+, N2H+, to name a few) should be observed with at least similar sensitivity to better constrain the models of chemistry in general and of this source in particular.
Though not explicitly announced nor discussed in their paper, acetic acid was already identified in Cernicharo et al. (2016).
Acknowledgments
We thank the referee, J. Bally, for the important corrections concerning sources x and n and for the suggested improvements to the Letter. We thank the IRAM ARC center for their hospitality and coaching for the ALMA data reduction process, and ESO for the financial support during the visit to the ARC (MARCUs funding). This work made use of the SIMBAD resource offered by CDS Strasbourg, France, of the CDMS and JPL molecular line databases offered by the Köln University and by NASA, respectively. LP acknowledges funding from AF ALMA-NOEMA, Paris Observatory. CF work is supported by the French National Research Agency in the framework of the Investissements d’Avenir program (ANR-15-IDEX-02), through the funding of the “Origin of Life” project of the Univ. Grenoble-Alpes. This work was carried out in part at the Jet Propulsion Laboratory, which is operated for NASA by the California Institute of Technology. EAB acknowledges support from the National Science Foundation grant AST-1514670. We thank E. Roueff for interesting discussions.
References
- Allen, D. A., & Burton, M. G. 1993, Nature, 363, 54 [NASA ADS] [CrossRef] [Google Scholar]
- Bally, J. M., Ginsburg, A., Arce, H., et al. 2017, ApJ, 837, 1 [Google Scholar]
- Blake, G. A., Sutton, E. C., Masson, C. R., & Phillips, T. G. 1987, ApJ, 315, 621 [NASA ADS] [CrossRef] [Google Scholar]
- Cernicharo, J., Tercero, B., Fuente, A., et al. 2013, ApJ, 771, L10 [NASA ADS] [CrossRef] [Google Scholar]
- Cernicharo, J., Kisiel, Z., Tercero, B., et al. 2016, A&A, 587, L4 [NASA ADS] [CrossRef] [EDP Sciences] [Google Scholar]
- Favre, C., Despois, D., Brouillet, N., et al. 2011, A&A, 532, A32 [NASA ADS] [CrossRef] [EDP Sciences] [Google Scholar]
- Favre, C., Pagani, L., Goldsmith, P. F., et al. 2017, A&A, 604, L2 [NASA ADS] [CrossRef] [EDP Sciences] [Google Scholar]
- Feng, S., Beuther, H., Henning, T., et al. 2015, A&A, 581, A71 [NASA ADS] [CrossRef] [EDP Sciences] [Google Scholar]
- Gómez, L., Rodríguez, L. F., Loinard, L., et al. 2005, ApJ, 635, 1166 [NASA ADS] [CrossRef] [Google Scholar]
- Greenhill, L. J., Gezari, D. Y., Danchi, W. C., et al. 2004, ApJ, 605, L57 [NASA ADS] [CrossRef] [Google Scholar]
- Liu, S.-Y., Girart, J. M., Remijan, A., & Snyder, L. E. 2002, ApJ, 576, 255 [NASA ADS] [CrossRef] [Google Scholar]
- Luhman, K. L., Robberto, M., Tan, J. C., et al. 2017, ApJ, 838 [Google Scholar]
- Nissen, H. D., Cunningham, N. J., Gustafsson, M., et al. 2012, A&A, 540, A119 [NASA ADS] [CrossRef] [EDP Sciences] [Google Scholar]
- Ohishi, M., Shin-ichi Ishikawa, S., Amano, T., et al. 1996, ApJ, 471, L61 [NASA ADS] [CrossRef] [Google Scholar]
- Orozco-Aguilera, M. T., Zapata, L. A., Hirota, T., Qin, S.-L., & Masqué, J. M. 2017, ApJ, 847 [Google Scholar]
- Pagani, L., Roueff, E., & Lesaffre, P. 2011, ApJ, 739, L35 [NASA ADS] [CrossRef] [Google Scholar]
- Pagani, L., Favre, C., Goldsmith, P. F., et al. 2017, A&A, 604, A32 [NASA ADS] [CrossRef] [EDP Sciences] [Google Scholar]
- Rieke, G. H., Low, F. J., & Kleinmann, D. E. 1973, ApJ, 186, L7 [NASA ADS] [CrossRef] [Google Scholar]
- Robberto, M., Beckwith, S. V. W., Panagia, N., et al. 2005, AJ, 129, 1534 [NASA ADS] [CrossRef] [Google Scholar]
- Rodríguez, L. F., Poveda, A., Lizano, S., & Allen, C. 2005, ApJ, 627, L65 [NASA ADS] [CrossRef] [Google Scholar]
- Rodríguez, L. F., Dzib, S. A., Loinard, L., et al. 2017, ApJ, 834, 1 [Google Scholar]
- Stoffels, A., Kluge, L., Schlemmer, S., & Brünken, S. 2016, A&A, 593, A56 [NASA ADS] [CrossRef] [EDP Sciences] [Google Scholar]
- Tercero, B., Cuadrado, S., López, A., et al. 2018, A&A, 620, L6 [NASA ADS] [CrossRef] [EDP Sciences] [Google Scholar]
- Wang, S., Bergin, E. A., Crockett, N. R., et al. 2011, A&A, 527, A95 [NASA ADS] [CrossRef] [EDP Sciences] [Google Scholar]
- Wright, M. C. H., & Plambeck, R. L. 2017, ApJ, 843 [Google Scholar]
- Youngblood, A., Ginsburg, A., & Bally, J. M. 2016, AJ, 151, 1 [CrossRef] [Google Scholar]
- Zapata, L. A., Schmid-Burgk, J., Ho, P. T. P., Rodríguez, L. F., & Menten, K. M. 2009, ApJ, 704, L45 [NASA ADS] [CrossRef] [Google Scholar]
- Zapata, L. A., Schmid-Burgk, J., & Menten, K. M. 2011, A&A, 529, A24 [NASA ADS] [CrossRef] [EDP Sciences] [Google Scholar]
Appendix A: Mid-infrared and millimeter continuum map comparison
We superimposed our 1.2 mm ALMA continuum map on the Greenhill et al. (2004) 12.5 μm map. The hot sources at 12.5 μm do not coincide with our 1.2 mm strongest peaks. Alternately, the emission peaks coincide toward both BN and IRc4. The HC itself is particularly weak at 12.5 μm, while there is a strong mid-infrared zone between the explosion center and HC (known as IRc2) and a weaker mid-infrared zone on the other side of the HC ridge. This confirms the claim of Zapata et al. (2011) of the absence of an internal heating source for the HC but of external heating possibly due to the explosion. From the Feng et al. (2015) data, we find that the HC does not seem to be gravitationally bound. The effect of the explosion on the overall stability of the HC is yet to be determined.
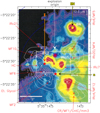 |
Fig. A.1. 1.2 mm continuum emission (white contours) superimposed on the 12.5 μm map from (Greenhill et al. 2004, shown in colors). The two runaway stars (BN and I) plus the quasi-static object n are indicated by five-pointed stars (yellow or red) while the 10 sources studied in Paper I are identified and denoted by crosses (white or red; see Paper I for more details). The presumed position of the origin of the explosion is denoted by a multi-pointed red and blue star. |
Appendix B: Multi-species comparisons at three remarkable velocities
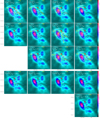 |
Fig. B.1. Selection of species at 3 different velocities (here ∼2.5 km s−1). There are no data for D2CO and NH2D due to line blending and for C2H5OH and c-C2H4O owing to lack of emission, i.e., maximum signal less than 10% of the peak emission. NO is partly masked, due to line blending. The top left corner indicates the channel velocity, the species, and its upper energy level. The white contours are 10 to 90% of the peak emission of the strongest channel for that species. The yellow arrows starting from the explosion center (red eight-pointed star) suggest possible displacement of gas linked to the explosive event, which occurred ∼550 years ago. The species shown in the top three rows such extensions, while the two bottom rows do not. The molecular species transitions are listed in Table B.1. All are channel maps of 488 kHz width (0.59–0.69 km s−1) |
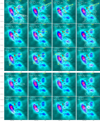 |
Fig. B.2. Selection of species at 3 different velocities (here ∼7.5 km s−1). The three top rows present species with extensions, the two bottom rows, without. NO is partly masked (where the emission is blended). |
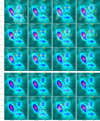 |
Fig. B.3. Selection of species at 3 different velocities (here ∼9 km s−1). The three top rows present species with expansions, the two bottom rows, without (except possibly c-C2H4O). NO is partly masked (where the emission is blended). |
All Tables
All Figures
|
Fig. 1. Selection of formaldehyde (H2CO, JKK′:918–919, at 216568.651 MHz) channel maps (δV = 0.68 km s−1). The top left corner indicates the channel velocity, the species, and its upper energy level. White contours are at 10 to 90% of the peak emission of the strongest channel for that species. Yellow arrows starting from the explosion center (red eight-pointed star) suggest possible displacement of gas linked to the explosive event, which occurred 550 ± 25 years ago. Five-pointed stars denote the position of the 10 sources studied in Paper I (Fig. 1, see also Fig. A.1 here). Underlying color map (enhanced by black contours) in this and subsequent figures is the 1.2 mm continuum emission (Paper I). |
| In the text | |
|
Fig. 2. Same as Fig. 1 for a selection of methanimine (H2CNH, JKK′:716–707, at 250161.775 MHz) channel maps (δV = 0.59 km s−1). |
| In the text | |
|
Fig. 3. Abundance variation with time of deuterated species following their release from grains. The range of values covers a factor of 10 in UV illumination variation. Vertical dashed lines indicate 500 and 1000 years. |
| In the text | |
|
Fig. A.1. 1.2 mm continuum emission (white contours) superimposed on the 12.5 μm map from (Greenhill et al. 2004, shown in colors). The two runaway stars (BN and I) plus the quasi-static object n are indicated by five-pointed stars (yellow or red) while the 10 sources studied in Paper I are identified and denoted by crosses (white or red; see Paper I for more details). The presumed position of the origin of the explosion is denoted by a multi-pointed red and blue star. |
| In the text | |
|
Fig. B.1. Selection of species at 3 different velocities (here ∼2.5 km s−1). There are no data for D2CO and NH2D due to line blending and for C2H5OH and c-C2H4O owing to lack of emission, i.e., maximum signal less than 10% of the peak emission. NO is partly masked, due to line blending. The top left corner indicates the channel velocity, the species, and its upper energy level. The white contours are 10 to 90% of the peak emission of the strongest channel for that species. The yellow arrows starting from the explosion center (red eight-pointed star) suggest possible displacement of gas linked to the explosive event, which occurred ∼550 years ago. The species shown in the top three rows such extensions, while the two bottom rows do not. The molecular species transitions are listed in Table B.1. All are channel maps of 488 kHz width (0.59–0.69 km s−1) |
| In the text | |
|
Fig. B.2. Selection of species at 3 different velocities (here ∼7.5 km s−1). The three top rows present species with extensions, the two bottom rows, without. NO is partly masked (where the emission is blended). |
| In the text | |
|
Fig. B.3. Selection of species at 3 different velocities (here ∼9 km s−1). The three top rows present species with expansions, the two bottom rows, without (except possibly c-C2H4O). NO is partly masked (where the emission is blended). |
| In the text | |
Current usage metrics show cumulative count of Article Views (full-text article views including HTML views, PDF and ePub downloads, according to the available data) and Abstracts Views on Vision4Press platform.
Data correspond to usage on the plateform after 2015. The current usage metrics is available 48-96 hours after online publication and is updated daily on week days.
Initial download of the metrics may take a while.