Fig. B.1.
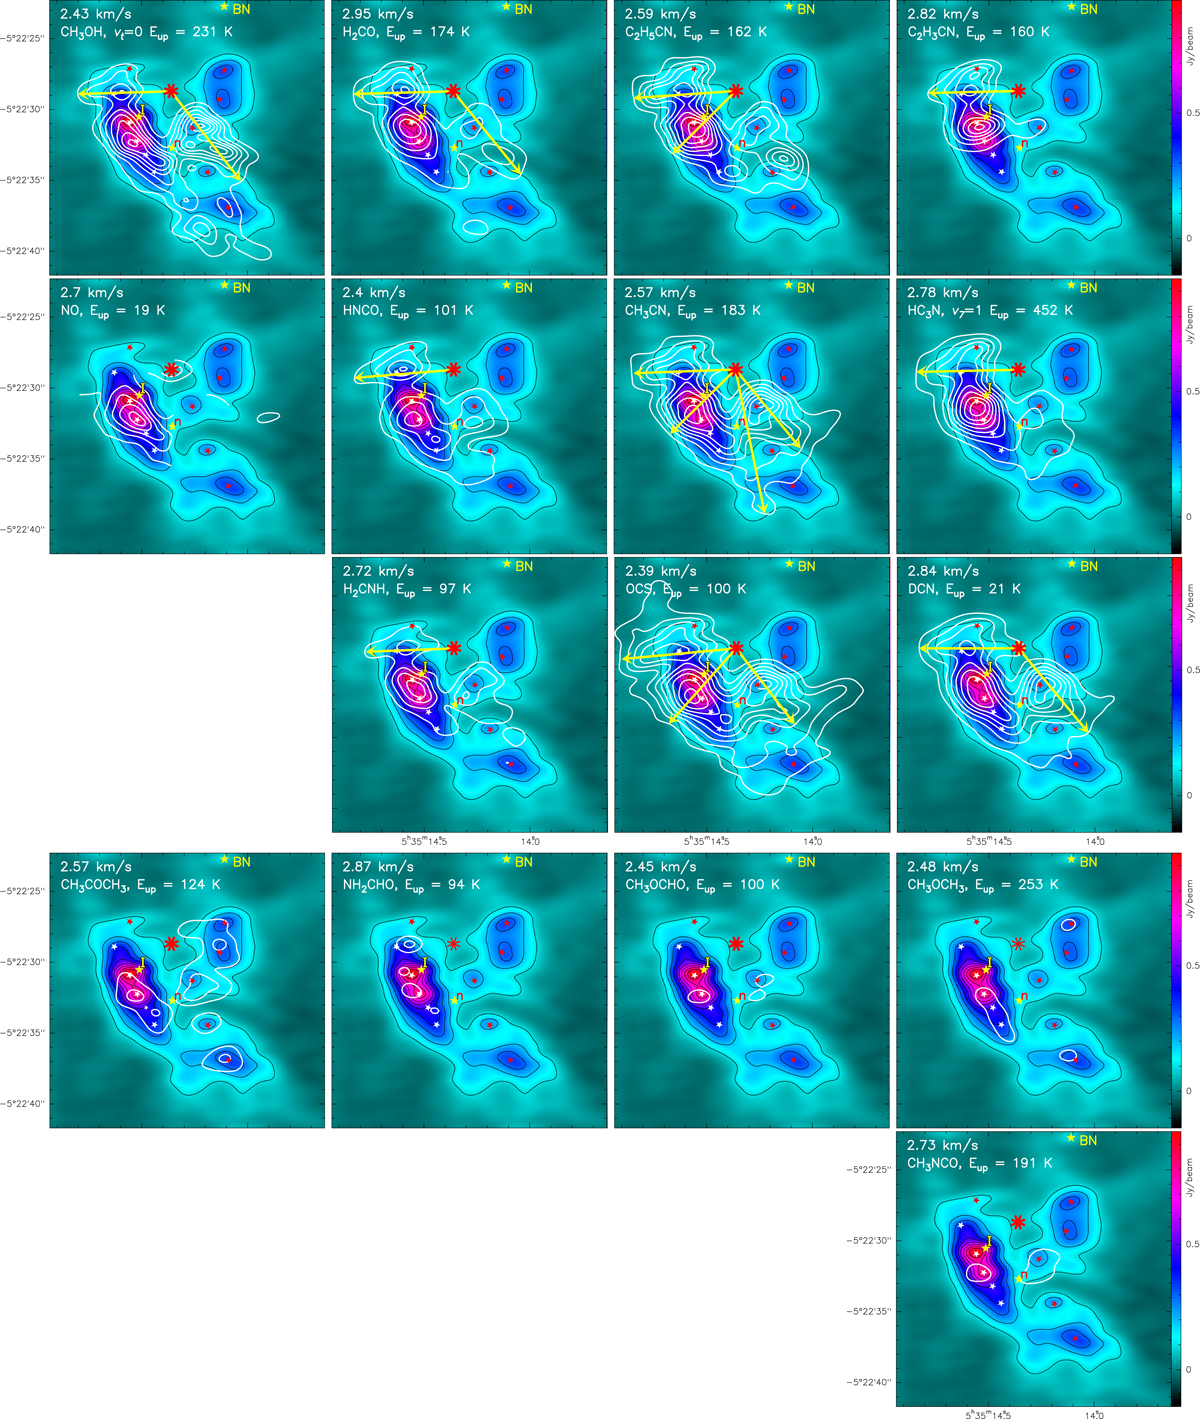
Selection of species at 3 different velocities (here ∼2.5 km s−1). There are no data for D2CO and NH2D due to line blending and for C2H5OH and c-C2H4O owing to lack of emission, i.e., maximum signal less than 10% of the peak emission. NO is partly masked, due to line blending. The top left corner indicates the channel velocity, the species, and its upper energy level. The white contours are 10 to 90% of the peak emission of the strongest channel for that species. The yellow arrows starting from the explosion center (red eight-pointed star) suggest possible displacement of gas linked to the explosive event, which occurred ∼550 years ago. The species shown in the top three rows such extensions, while the two bottom rows do not. The molecular species transitions are listed in Table B.1. All are channel maps of 488 kHz width (0.59–0.69 km s−1)
Current usage metrics show cumulative count of Article Views (full-text article views including HTML views, PDF and ePub downloads, according to the available data) and Abstracts Views on Vision4Press platform.
Data correspond to usage on the plateform after 2015. The current usage metrics is available 48-96 hours after online publication and is updated daily on week days.
Initial download of the metrics may take a while.