Fig. A.1.
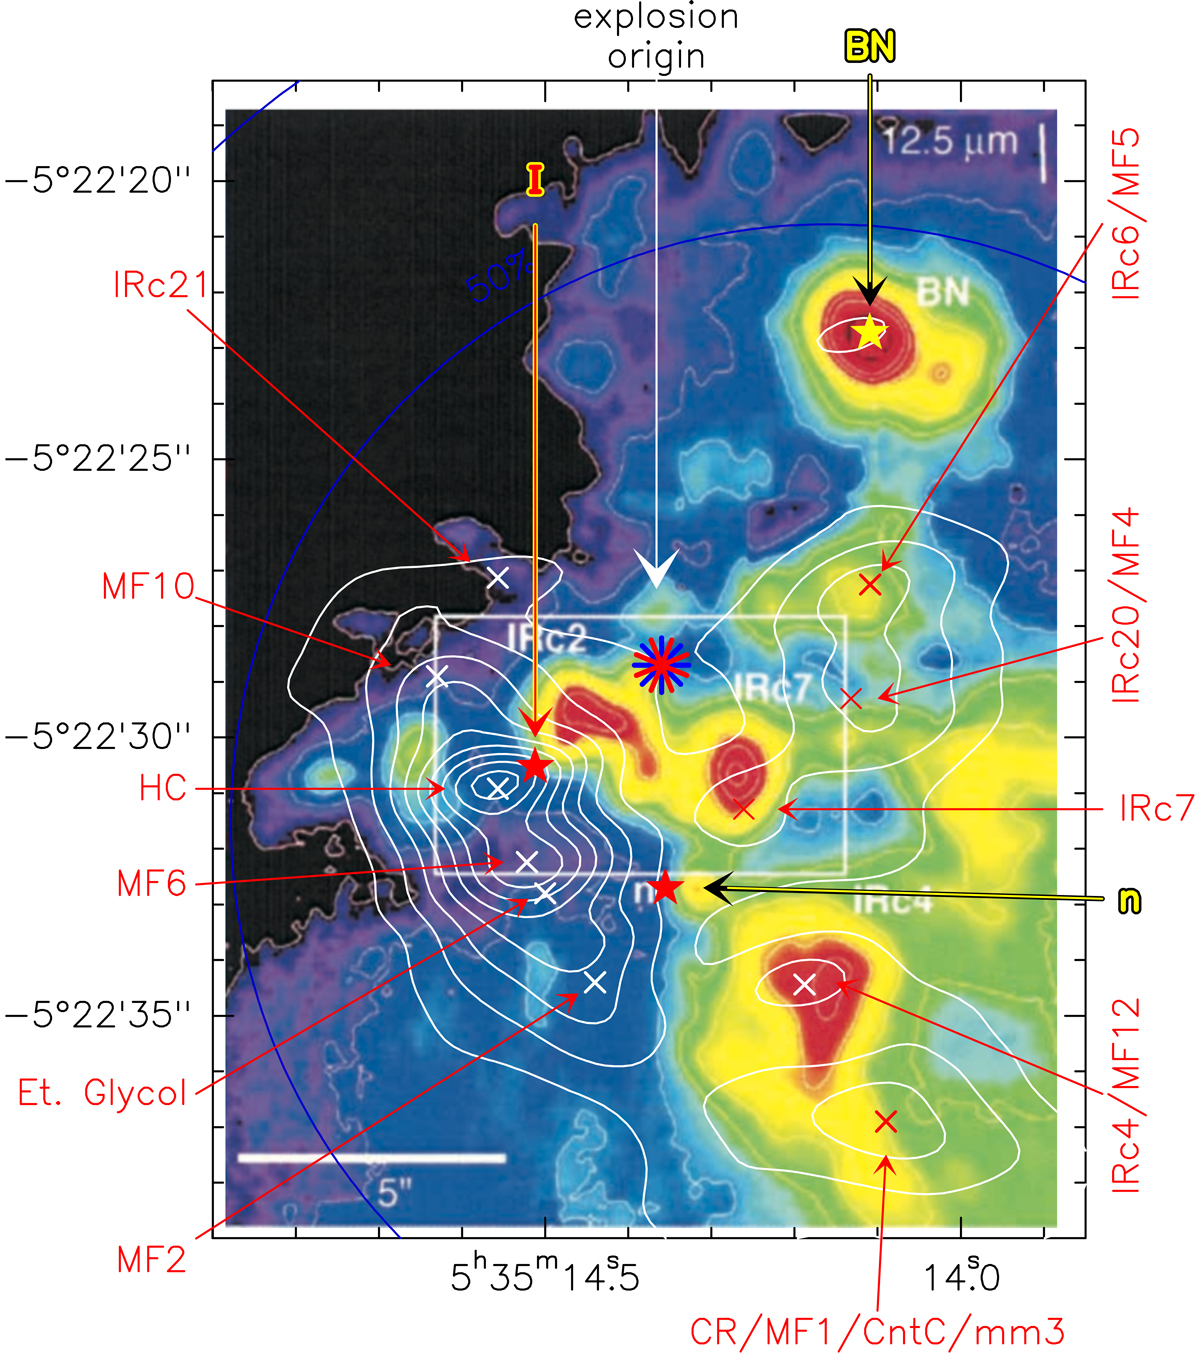
1.2 mm continuum emission (white contours) superimposed on the 12.5 μm map from (Greenhill et al. 2004, shown in colors). The two runaway stars (BN and I) plus the quasi-static object n are indicated by five-pointed stars (yellow or red) while the 10 sources studied in Paper I are identified and denoted by crosses (white or red; see Paper I for more details). The presumed position of the origin of the explosion is denoted by a multi-pointed red and blue star.
Current usage metrics show cumulative count of Article Views (full-text article views including HTML views, PDF and ePub downloads, according to the available data) and Abstracts Views on Vision4Press platform.
Data correspond to usage on the plateform after 2015. The current usage metrics is available 48-96 hours after online publication and is updated daily on week days.
Initial download of the metrics may take a while.