Fig. 1.
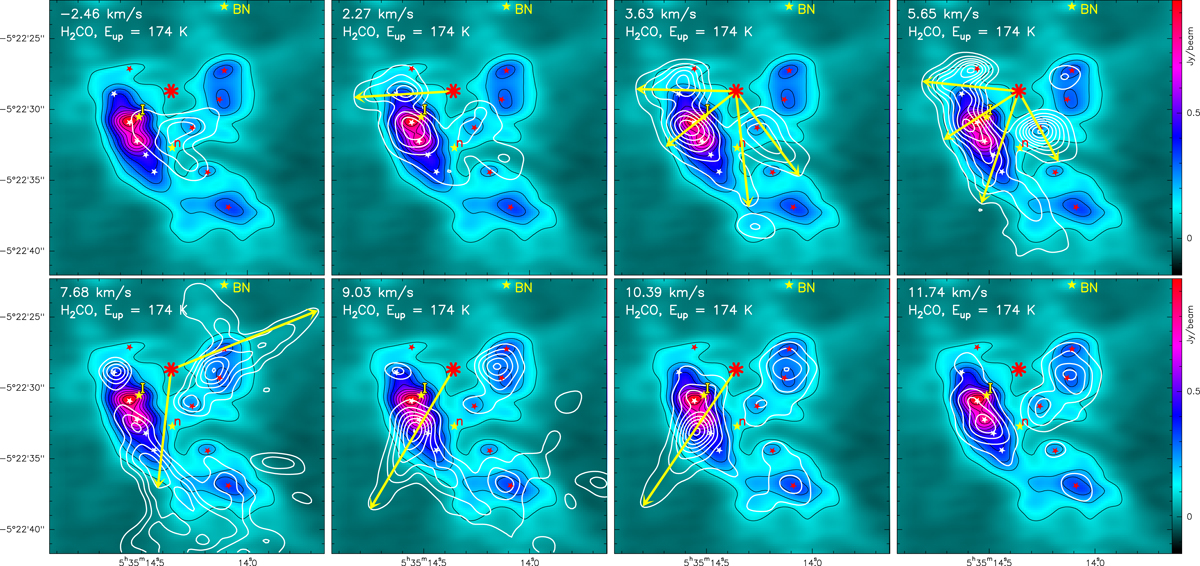
Selection of formaldehyde (H2CO, JKK′:918–919, at 216568.651 MHz) channel maps (δV = 0.68 km s−1). The top left corner indicates the channel velocity, the species, and its upper energy level. White contours are at 10 to 90% of the peak emission of the strongest channel for that species. Yellow arrows starting from the explosion center (red eight-pointed star) suggest possible displacement of gas linked to the explosive event, which occurred 550 ± 25 years ago. Five-pointed stars denote the position of the 10 sources studied in Paper I (Fig. 1, see also Fig. A.1 here). Underlying color map (enhanced by black contours) in this and subsequent figures is the 1.2 mm continuum emission (Paper I).
Current usage metrics show cumulative count of Article Views (full-text article views including HTML views, PDF and ePub downloads, according to the available data) and Abstracts Views on Vision4Press platform.
Data correspond to usage on the plateform after 2015. The current usage metrics is available 48-96 hours after online publication and is updated daily on week days.
Initial download of the metrics may take a while.