| Issue |
A&A
Volume 624, April 2019
|
|
|---|---|---|
| Article Number | A142 | |
| Number of page(s) | 6 | |
| Section | Stellar structure and evolution | |
| DOI | https://doi.org/10.1051/0004-6361/201935185 | |
| Published online | 26 April 2019 | |
IGR J17503–2636: a candidate supergiant fast X-ray transient
1
Department of Astronomy, University of Geneva, Chemin d’Écogia 16, 1290 Versoix, Switzerland
e-mail: This email address is being protected from spambots. You need JavaScript enabled to view it.
2
Dipartimento di Fisica, SP Monserrato-Sestu, Universitá degli Studi di Cagliari, km 0.7, 09042 Monserrato, Italy
3
National Space Institute, Technical University of Denmark, Elektrovej 327-328, 2800 Lyngby, Denmark
4
Dipartimento di Fisica e Chimica, Università degli Studi di Palermo, Via Archirafi 36, 90123 Palermo, Italy
Received:
31
January
2019
Accepted:
20
March
2019
Abstract
The object IGR J17503–2636 is a hard X-ray transient discovered by INTEGRAL on 2018 August 11. This was the first ever reported X-ray emission from this source. Following the discovery, follow-up observations were carried out with Swift, Chandra, NICER, and NuSTAR. Here we report on the analysis of all of these X-ray data and the results obtained. Based on the fast variability in the X-ray domain, the spectral energy distribution in the 0.5–80 keV energy range, and the reported association with a highly reddened OB supergiant at ∼10 kpc, we conclude that IGR J17503–2636 is most likely a relatively faint new member of the supergiant fast X-ray transients. Spectral analysis of the NuSTAR data revealed a broad feature in addition to the typical power-law with exponential roll-over at high energy. This can be modeled either in emission or as a cyclotron scattering feature in absorption. If confirmed by future observations, this feature would indicate that IGR J17503–2636 hosts a strongly magnetized neutron star with B ∼ 2 × 10¹² G.
Key words: accretion / accretion disks / methods: observational / binaries: close / stars: neutron / X-rays: binaries
© ESO 2019
1. Introduction
The object IGR J17503–2636 is an X-ray transient discovered by the JEM-X instruments (Lund et al. 2003) on-board INTEGRAL (Winkler et al. 2003) during observations of the Galactic bulge performed on 2018 August 11 (satellite revolution 1986; Chenevez et al. 2018). Upon discovery, the source flux in the JEM-X data covering from 07:44 to 12:30 UT was estimated at 3.9 × 10⁻¹⁰ erg cm−2 s−1 (3–19 keV). The source was not initially detected in the quick-look analysis of the higher energy INTEGRAL instrument IBIS/ISGRI (Ubertini et al. 2003; Lebrun et al. 2003).
A 1 ks-long follow-up observation with Swift/XRT (Burrows et al. 2005) was carried out on 2018 August 13 at 19:41 UT in order to provide the first characterization of the source emission in the soft X-rays and improve the X-ray position down to arcsecond accuracy. The preliminary analysis of XRT data revealed a variable absorption in the range (6.2–13.7) × 1022 cm−2 (assuming a Galactic absorption column density in the direction of the source of 1.3 × 1022 cm−2) and provided a measurement of the variable 0.3–10 keV flux during the observation in the range (2.0–8.3) × 10−11 erg cm−2 s−1 (Chenevez et al. 2018). The most accurate localisation of the source was obtained from a 1 ks-long Chandra observation at RA(J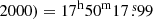 , Dec(J
 with an associated uncertainty of
  at 90% confidence level (the observation was carried out on 2018 August 23 at 23:31 UT; Chakrabarty et al. 2018a,b). Only eleven events from the source were recorded by Chandra, and no spectral or timing analysis could be performed (the estimated X-ray flux in the 0.5–10 keV energy band was 2.9 × 10⁻¹² erg cm−2 s−1). The accurate Chandra position allowed Masetti et al. (2018) for the identification of the IR counterpart of IGR J17503–2636 as a heavily reddened OB (super)giant star located beyond the Galactic center at about 10 kpc, thus classifying the INTEGRAL transient as a high-mass X-ray binary (HMXB; Walter et al. 2015). The fast flaring behavior and the rapid decay in the X-ray flux suggests an association of IGR J17503–2636 to the HMXB sub-class of the supergiant fast X-ray transients (SFXTs; Sguera et al. 2005, 2006; Negueruela et al. 2006; Martínez-Núñez et al. 2017), as we discuss in Sect. 3.
In this paper, we report on all available X-ray data that were collected during the first reported X-ray emission episode from IGR J17503–2636 with the instruments onboard INTEGRAL, NuSTAR, Swift, and NICER, together with our interpretations.
2. X-ray data
For all instruments, we performed spectral analysis with Xspec 12.10.0c (Arnaud et al. 1996). All uncertainties in the paper are given at 90% confidence level, unless stated otherwise. A summary of all observations with common spectral results is reported in Table 1; we refer to the following paragraphs for a detailed description of the spectral analysis for each X-ray facility.
Log of X-ray observations with the best-fit spectral parameters.
2.1. INTEGRAL data
INTEGRAL observations are divided into science windows (ScWs), that is, pointings with a typical duration of ∼2–3 ks. To minimize calibration uncertainties and maximize the exposure, we selected all publicly available pointings with a limited off axis angle from the source: 10 deg from IBIS/ISGRI and 4 deg for JEM-X1. All data were processed with version 11.0 of the Off-line Scientific Analysis software (OSA) distributed by the ISDC (Courvoisier et al. 2003).
We extracted the IBIS/ISGRI and JEM-X mosaics by stacking all available data from 2018 August 10 at 15:50 to 2018 August 08 at 18:52. IGR J17503–2636 was detected in the IBIS/ISGRI 25–80 keV mosaic at a significance of 7σ (single trial, effective exposure time 54.5 ks) and in the JEM-X 3–25 keV mosaic at a significance of 6σ (single trial, effective exposure time 21.7 ks). We show a zoom of the IBIS/ISGRI and JEM-X mosaics around the position of IGR J17503–2636 in Fig. 1. We extracted the IBIS/ISGRI light curve in the 25–80 keV energy range and with one science window time granularity, but we could not detect any significant variability (at 3σ confidence level). The JEM-X coverage (considering a maximum off-axis angle of four degrees) is limited to a few ScWs, not allowing for any variability study. Thus, we extracted a single spectrum integrating over the entire exposure time available for ISGRI, JEM-X1, and JEM-X2 data. The JEM-X (IBIS/ISGRI) spectra were computed in eight (five) logarithmic, equally spaced bins between 3 and 35 keV (25 and 100 keV). Due to instrumental systematic uncertainties and inconsistencies between the two JEM-X units, we limited the use of data in the range ∼5–25 keV for JEM-X2 and ∼7–25 keV for JEM-X1. These spectra (Fig. 2) show a good fit ( /d.o.f. = 0.6/10) to a simple power-law model (TBabs*pegpwrlaw in XSPEC) with best-fit parameters reported in Table 1.
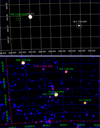 |
Fig. 1. Zoom of the JEM-X (upper panel) and IBIS/ISGRI (bottom panel) mosaic of the region around IGR J17503–2636 obtained by combining all publicly available data from 2018 August 10 at 15:50 to 2018 August 11 at 18:52. The source is detected at a significance of 7σ in the IBIS/ISGRI mosaic and 6σ in the JEM-X mosaic. |
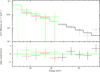 |
Fig. 2. Unfolded JEM-X1 (red), JEM-X2 (green), and IBIS/ISGRI (black) spectra obtained by integrating over all available data between 2018 August 10 at 15:50 and 2018 August 11 at 18:52. The best fit is obtained with an absorbed power-law model (see text for details). Residuals from the fit are shown in the bottom panel. |
Finally, we checked that the source was not detected during the following INTEGRAL visibility period (2018 August 17 14:03–2018 August 19 18:08). We derived an upper limit on its X-ray flux of 4 × 10⁻¹⁰ erg cm−2 s−1 in the 3–80 keV energy range at 3σ confidence level (assuming a power-law photon index of 2.8).
2.2. NuSTAR data
The object IGR J17503–2636 was observed by NuSTAR (Harrison et al. 2013) from 2018 August 22 at 11:01 to August 23 at 10:26 (UT; ID 90401333002). After having applied all the good time intervals (GTI) to the NuSTAR data, accounting for the Earth occultation and the South Atlantic Anomaly passages, we obtained an effective exposure time of 39.1 ks for both the focal plane modules A and B (FPMA and FPMB). All data were processed via NUPIPELINE V0.46 and the latest calibration files available at the time of writing (v.20181022). The source spectra and light curves were extracted from a 80 arcsec circle centered on the source, while the background products were extracted from a region with a similar extension but centered on a region free from the contamination of both stray light and source emission. Various extraction regions were also used for the source and background products to verify that none of the timing and spectral features could be affected by specific choices.
The FPMA and FPMB light curves of the source display remarkable variability. Figure 3 shows the FPMA light curves of the source in two energy bands (3–10 keV and 10–60 keV) and the corresponding hardness ratio (HR) calculated with an adaptive rebinning of the light curves in order to achieve a S/N of at least 10 in each time bin (based on the soft light curve; see Bozzo et al. 2013, for more details). We verified that compatible results could be obtained from the FPMB light curves.
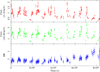 |
Fig. 3. NuSTAR FPMA light curves of IGR J17503–2636 in the 3–10 keV and 10–60 keV energy bands (upper panels) and the hard-to-soft ratio (HR, bottom panel). The light curves have been rebinned in order to achieve S/N ≳ 10 in each time bin of the soft energy band. |
In order to investigate the origin of the pronounced variability characterizing the NuSTAR light curves, we carried out a timing analysis of the data using event files where the arrival time of all recorded photons was framed at the Solar system barycenter using the BARYCORR tool. We accumulated light curves in the 3–60 keV energy range with bins of 0.005 s and summed FPMA and FPMB to increase the statistics. We built a power spectrum averaging on segments of 524 288 bins so that most satellite orbits contain one or more intervals. Segments resulting in an exposure of less than 50% were discarded while the others were padded with zeros. Eventually, we averaged the power spectrum over 15 segments. Figure 4 shows the resulting power spectrum with the corresponding empirical model function for the combined white and red noise: a constant (1.991 ± 0.002) plus a power-law with index −1.67 ± 0.09.
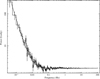 |
Fig. 4. Power spectral density of the NuSTAR summed light curve in the 3–60 keV energy range binned at 0.005 s. The power spectrum was obtained by averaging 15 segments of 524288 bins and rebinned geometrically with a factor of 0.05. |
From the power spectrum of Fig. 4, we can infer that there is no obvious periodicity. We used the best-fit model of the power spectral density (PSD) as the expected value of the power at each frequency and computed an upper limit on the pulsed fraction between 0.7 and 7% at 99% confidence level, using Eq. (A.4) from Israel & Stella (1996).
Given the relatively low count-rate of the source recorded by NuSTAR and the lack of prominent HR variations in Fig. 3, we extracted and fit together the FPMA and FPMB spectra of the source accumulated by using the entire exposure time available, after applying an optimal binning (Kaastra & Bleeker 2016). The source emission is mainly characterized by an absorbed power-law with a high-energy exponential cutoff and an iron line emission centered at ∼6.4 keV with an equivalent width of about 0.3 keV. A fit with this simple model however left evident residuals especially around 10–20 keV: an additional component is required to obtain an acceptable result. We verified that spectral fits with the most common phenomenological single-component models leave equivalent residuals (e.g., Fermi-Dirac cutoff, negative and positive power law-NPEX; see Coburn et al. 2002). We could not unequivocally determine whether this additional required component is in absorption or in emission, as both the models TBabs*(highecut*pegpwrlaw*gabs + Gaussian) (referred as Gabs in Table 2) and TBabs*(highecut*pegpwrlaw + Gaussian + Gaussian) (Gaussian in Table 2) could successfully describe the data (see Fig. 5). Therefore, we report the best-fit parameters obtained by using both models in Table 2. In this table, NH is the absorption column density of the Tbabs component, EC (EF) is the cut-off (fold) energy of the highecut component, Γ is the power-law photon index, and Fpl is the intrinsic flux of the power-law component. It should be noted that the cutoff energy could not be constrained for the model with the additional Gaussian emission feature and was fixed at 1 keV, outside of the energy range of NuSTAR data. We indicated with EFe, σFe, and NFe the centroid energy, width, and normalization of the iron line, respectively. The symbols ECyc, σCyc, and τ/NCyc are the centroid energy, width, and depth/normalization of the absorption or emission component, respectively, possibly associated with cyclotron scattering.
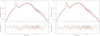 |
Fig. 5. Unfolded FMPA (black) and FMPB (red) spectra of IGR J17503–2636 extracted using the entire exposure time available within the observation ID 90401333002. Right panel: results for the fit obtained with the model TBabs*(highecut*pegpwrlaw + Gaussian + Gaussian), while left panel corresponds to the case where the model TBabs*(highecut*pegpwrlaw*gabs + Gaussian) was used. In both cases, the residuals from the fits are shown in the bottom panels. |
Spectral results obtained by fitting together the NuSTAR FPMA and FPMB data of IGR J17503–2636 (taken from 2018 August 22 at 11:01 to August 23 at 10:26 UT)).
2.3. Swift data
The object IGR J17503–2636 was observed twice by the Neil Gehrels Swift Observatory (Burrows et al. 2005) on 2018 August 13 at 19:43 (UT) for a total exposure time of 984 s and on 2018 August 23 at 04:39 (UT) for a total exposure time of 1848 s. In both cases, data were collected in photon counting (PC) mode.
The XRT data were analyzed using the standard software (HEASOFT v6.25) and the latest calibration files available (CALDB 20180710). All data were processed and filtered with XRTPIPELINE (v0.13.4). We verified that no data were significantly affected by pileup. The source events were extracted using the photo counting observing mode from a circular region with a radius of 20 pixels (where 1 pixel corresponds to  ), while background events were extracted from a source-free region with a similar radius. We show in Fig. 6 the background subtracted XRT light curve of the two observations in the 0.5–10 keV energy band corrected for point spread function losses and vignetting. The XRT spectra extracted from each observation were binned using the Kaastra & Bleeker (2016) algorithm and could be well fit with an absorbed power-law model (TBABS*PEGPWRLAW in XSPEC) by minimizing the Cash statistics (C-stat in XSPEC). A log of XRT observations, together with the corresponding results from the spectral fits, is reported in Table 1. Figure 7 shows the count-rate spectra. It can be noted that during the second observation, the source faded significantly and the spectral parameters are less constrained.
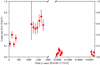 |
Fig. 6. Swift/XRT light curve of IGR J17503–2636 as obtained from the two available observations. The bin time is 100 s and the light curve has been corrected for the background, as well as all instrumental effects (0.5–10 keV). |
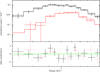 |
Fig. 7. Swift/XRT spectra extracted from the observations ID 00010807001 (black) and 00088805001 (red). The best fit model is shown with solid lines in the upper panel, while residuals from the best fit are reported in the bottom panel. We used the XSPEC option setplot rebin 5 5 for plotting purposes. |
2.4. NICER data
Following the discovery of IGR J17503–2636, Neutron star Interior Composition Explorer (NICER; Gendreau et al. 2016) took the opportunity to monitor this source between 2018 August 14 at 21:24 and 2018 August 16 13:20 UT with an effective exposure of ∼3.7 ks. We analyzed data from the observations ID 1200320101 and 1200320103 using NICERDAS version 2018-04-24 and HEASoft 6.24 package. We reprocessed the data using the “nicerl2” pipeline. Good time intervals were created using the standard filtering criteria, for example, the angle of bright Earth >40°, elevation >30°, pointing offset of ≤54 arcsec and excluding data collected during the passages through the South Atlantic Anomaly region. We applied the GTI for the spectral extraction using XSELECT. NICER observations of blank sky region (RXTE-6) were chosen for background measurements. We used version 1.02 of the NICER response and effective area files for the spectral fitting.
We optimally rebinned the spectra using the algorithm by Kaastra & Bleeker (2016) and limited our energy range from 1 to 11 keV. Both NICER spectra can be well described with an absorbed power-law model (we used the model TBABS*PEGPOWERLAW). We report the results in Table 1 noting that we minimized the Cash statistic with background subtraction (C-stat in XSPEC). The two spectra together with the residuals from the best fit are shown in Fig. 8.
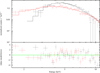 |
Fig. 8. NICER spectra extracted from the observations ID 1200320101 (black) and 1200320103 (red). The best fit model is shown with solid lines in the upper panel, while residuals from the best fit are reported in the bottom panel. We used the XSPEC option setplot rebin 5 5 and removed empty bins for plotting purposes. |
The power density spectrum of the NICER observation is consistent with white noise from ∼10−3 to 500 Hz. The upper limits that we were able to obtain on the pulsed fraction are less constraining than those reported for NuSTAR data owing to the shorter exposure and higher background of the NICER observations.
3. Discussion
We report on the transient source IGR J17503–2636, whose first detectable X-ray emission was discovered with INTEGRAL on 2018 August 11. The source was followed up by Chandra, NuSTAR, Swift, and NICER.
Source IGR J17503–2636 was relatively faint for the instruments onboard INTEGRAL, and therefore only a preliminary description of the broad-band spectrum could be obtained from the available JEM-X and IBIS/ISGRI data. INTEGRAL data showed that the X-ray emission from the source faded very rapidly, decreasing below the detection limit of JEM-X and IBIS/ISGRI within one revolution (2.7 days), supporting a fast flaring behavior. The more sensitive instruments onboard NuSTAR, Swift, and NICER revealed that significant X-ray emission from the source could be detected at least until early August 23, albeit at an intensity a factor of ∼50 lower than that recorded by INTEGRAL. The Chandra observation carried out later the same day showed a further decrease in intensity by at least another factor of ∼10 and down to 2.9 × 10⁻¹² erg cm−2 s−1 (Chakrabarty et al. 2018a,b).
In the soft to hard X-ray domains (0.5–80 keV), the emission from IGR J17503–2636 is characterized by remarkable variability on timescales from a few seconds to a few thousand seconds, typical of what is usually observed in wind-fed HMXBs (see Walter et al. 2015, for a recent review). This variability is best appreciated by looking at the NuSTAR light curves which present a much higher S/N and longer exposure compared to all other available instruments (see Fig. 3). Although within the NuSTAR observation we did not record prominent variations in the HR, a comparison between all spectra results2 reported in Sects. 2.1–2.4 highlights significant changes in the absorption column density (up to a factor of ∼10) and in the power-law slope (up to a factor of ∼3). These changes, as well as the much higher value of NH compared to the expected Galactic extinction in the direction of the source (Chenevez et al. 2018), support the idea of IGR J17503–2636 being a wind-fed HMXB. It is well known that in these systems the fast wind of a massive companion star (typically an OB supergiant) can lead to the formation of a cocoon of dense material around the accreting compact object and the local density/velocity variations of the wind can give rise to an X-ray variability on compatible timescales compared to those observed from IGR J17503–2636 (see, e.g., Martínez-Núñez et al. 2017, for a recent review).
Although the present observations do not allow us to firmly establish the nature of the accreting compact object in this source, the broad-band spectral analysis revealed properties that are strongly reminiscent of what is usually observed from neutron star (NS) HMXBs (see, e.g., Klochkov et al. 2007; Walter et al. 2015). The cut-off power-law spectrum is commonly observed in these systems, and the iron line at 6.4 keV is often observed as a consequence of the fluorescence of X-rays from the NS onto the surrounding stellar wind material or accretion disk. The peculiar feature around 10–20 keV that we modeled with either a Gaussian emission component or a multiplicative absorbing Gaussian profile is a known signature of a strongly magnetized NS. The interpretation of an emission feature at these energies is associated, as suggested for other HMXBs, to thermal and bulk Comptonization of magnetized bremsstrahlung seed photons along the accretion column (Ferrigno et al. 2009; Farinelli et al. 2016). The presence of an absorption feature would be explained by assuming this is a broad absorption line produced by scattering on electrons bounded around the field lines of a strong magnetic field (also known as “cyclotron line”). These features are observed in many NS HMXBs and their centroid energy provides a direct estimate of the NS magnetic field strength according to the equation:
 (1)
(1)
where B12 is the magnetic field in units of 1012 Gauss and z is the gravitational redshift at the emission site (the above equation is valid for the fundamental CRSF; see, e.g., Staubert et al. 2019, for a recent review). If we accept this interpretation, we can conclude that the accreting object in IGR J17503–2636 is a NS endowed with a magnetic field of ∼2 × 10¹² G, compatible with other measured magnetic field strengths in NS HMXBs. The 4 keV width of the scattering feature is also typical for these objects and might indicate a plasma temperature of 10–20 keV, in agreement with the cutoff energy. However, this should be taken with caution, since the line width depends on the line-of-sight angle to the magnetic field. Future observations of additional episodes of enhanced X-ray emission from IGR J17503–2636 with a high-sensitivity broad-band X-ray instrument such as the FPMs on-board NuSTAR will hopefully be able to provide higher-S/N spectra and rule out any other alternative interpretation of the feature around 20 keV from the spectral fitting.
A final convincing indication of the HMXB nature of IGR J17503–2636 is provided by the identification of the near-infrared counterpart reported by Masetti et al. (2018). This led to the specific association of the source with the class of the supergiant HMXBs3. These systems are generally divided into two sub-classes, the so-called classical systems and the supergiant fast X-ray transients (SFXTs; see, e.g., Martínez-Núñez et al. 2017, for a recent review). The former are variable but persistent systems, showing on average a luminosity that is well explained by using a wind accretion scenario onto a compact object (usually a strongly magnetized NS). The SFXTs display a much more prominent variability in the X-rays, alternating between outbursts lasting hours that reach the typical luminosity of classical systems and extended periods of quiescence where the X-ray luminosity can decrease by up to a factor of 105–106. This behavior is far from being understood and is still actively debated (see, e.g., the discussion in Bozzo et al. 2017). Data collected so far from IGR J17503–2636 would favor the connection with the SFXT sub-class, as the source underwent a relatively bright episode of X-ray emission at the time of discovery with JEM-X and then became progressively fainter down until it got close to the detection threshold for Chandra (the X-ray bright phase displayed by IGR J17503–2636 was about ∼12 days long in total, a duration that is not uncommon in other SFXTs; see, e.g., Sguera et al. 2015). Although the total variation in the X-ray luminosity recorded so far is of ∼300 (see Sect. 1) and thus significantly lower than that usually measured from the SFXTs, the fact that no X-ray emission was ever recorded before from this object suggests that the true quiescent luminosity could be lower than the value measured during the Chandra observation. The overall dynamic range in the X-ray domain could therefore be even larger. Masetti et al. (2018) suggested from the reddening of the OB supergiant that this system is located beyond the Galactic center at ∼10 kpc, and thus the outburst luminosity derived from the JEM-X flux would be of ∼2 × 1036 erg s−1, while the NuSTAR 0.5–100 keV flux would correspond to a luminosity of ∼1036 erg s−1. This value is similar to what is observed from the faintest SFXT outbursts, which can achieve a luminosity of up to ≳1038 erg cm−2 s−1 (Romano et al. 2015). As a consequence, it is possible that this is a peculiarly faint system also during outbursts, explaining why no previous detection with INTEGRAL or Swift/BAT was ever reported, whilst usually up to a few outbursts per year are detected from the known SFXTs (see, e.g., Paizis & Sidoli 2014; Romano 2015; Sidoli & Paizis 2018).
Note that we did not attempt to perform a combined fit between the different instruments because data from INTEGRAL, NuSTAR, NICER, and Swift were obtained at largely different epochs and the significant spectral changes recorded in these data would make it very difficult to provide a consistent interpretation of the results. Furthermore, given the large absorption column density revealed in the direction of the source, the limited S/N of the NICER and Swift data would not add significant information to the fit of the NuSTAR data that can satisfactorily cover alone a broad-band emission range extending from 3 up to 40 keV.
We note that other authors have questioned this conclusion, even though a firm identification of this object might require additional observations (McCollum et al. 2018).
Acknowledgments
We are grateful to the NuSTAR, Swift, and NICER teams for the prompt scheduling of the ToO observations of IGR J17503–2636. We acknowledge financial contribution from the agreement ASI-INAF n. 2017-14-H.O. We acknowledge support from the HERMES Project, financed by the Italian Space Agency (ASI) Agreement n. 2016/13 U.O. GKJ acknowledges support from the Marie Skłodowska-Curie Actions grant no. 713683 (H2020; COFUNDPostdocDTU)
References
- Arnaud, K. A. 1996, in Astronomical Data Analysis Software and Systems V, eds. G. H. Jacoby, & J. Barnes, ASP Conf. Ser., 101, 17 [NASA ADS] [Google Scholar]
- Bozzo, E., Romano, P., Ferrigno, C., et al. 2013, A&A, 556, A30 [NASA ADS] [CrossRef] [EDP Sciences] [Google Scholar]
- Bozzo, E., Bernardini, F., Ferrigno, C., et al. 2017, A&A, 608, A128 [NASA ADS] [CrossRef] [EDP Sciences] [Google Scholar]
- Burrows, D. N., Hill, J. E., Nousek, J. A., et al. 2005, Space Sci. Rev., 120, 165 [NASA ADS] [CrossRef] [Google Scholar]
- Chakrabarty, D., Jonker, P. G., & Markwardt, C. B. 2018a, ATel, 11990 [Google Scholar]
- Chakrabarty, D., Jonker, P. G., & Markwardt, C. B. 2018b, ATel, 11991 [Google Scholar]
- Chenevez, J., Jaisawal, G., Kuulkers, E., et al. 2018, ATel, 11952 [Google Scholar]
- Coburn, W., Heindl, W. A., Rothschild, R. E., et al. 2002, ApJ, 580, 394 [NASA ADS] [CrossRef] [Google Scholar]
- Courvoisier, T. J.-L., Walter, R., Beckmann, V., et al. 2003, A&A, 411, L53 [NASA ADS] [CrossRef] [EDP Sciences] [Google Scholar]
- Farinelli, R., Ferrigno, C., Bozzo, E., & Becker, P. A. 2016, A&A, 591, A29 [NASA ADS] [CrossRef] [EDP Sciences] [Google Scholar]
- Ferrigno, C., Becker, P. A., Segreto, A., Mineo, T., & Santangelo, A. 2009, A&A, 498, 825 [NASA ADS] [CrossRef] [EDP Sciences] [Google Scholar]
- Gendreau, K. C., Arzoumanian, Z., Adkins, P. W., et al. 2016, in Space Telescopes and Instrumentation 2016: Ultraviolet to Gamma Ray, Proc. SPIE, 9905, 99051H [CrossRef] [Google Scholar]
- Harrison, F. A., Craig, W. W., Christensen, F. E., et al. 2013, ApJ, 770, 103 [NASA ADS] [CrossRef] [Google Scholar]
- Israel, G. L., & Stella, L. 1996, ApJ, 468, 369 [NASA ADS] [CrossRef] [Google Scholar]
- Kaastra, J. S., & Bleeker, J. A. M. 2016, A&A, 587, A151 [NASA ADS] [CrossRef] [EDP Sciences] [Google Scholar]
- Klochkov, D., Horns, D., Santangelo, A., et al. 2007, A&A, 464, L45 [NASA ADS] [CrossRef] [EDP Sciences] [Google Scholar]
- Lebrun, F., Leray, J. P., Lavocat, P., et al. 2003, A&A, 411, L141 [NASA ADS] [CrossRef] [EDP Sciences] [Google Scholar]
- Lund, N., Budtz-Jørgensen, C., Westergaard, N. J., et al. 2003, A&A, 411, L231 [NASA ADS] [CrossRef] [EDP Sciences] [Google Scholar]
- Martínez-Núñez, S., Kretschmar, P., Bozzo, E., et al. 2017, Space Sci. Rev., 212, 59 [NASA ADS] [CrossRef] [Google Scholar]
- Masetti, N., Ferreira, T. S., Saito, R. K., Kammers, R., & Minniti, D. 2018, ATel, 11992 [Google Scholar]
- McCollum, B., Laine, S., & McCollum, M. 2018, Res. Notes Am. Astron. Soc., 2, 193 [CrossRef] [Google Scholar]
- Negueruela, I., Smith, D. M., Reig, P., Chaty, S., & Torrejón, J. M. 2006, in The X-ray Universe 2005, ed. A. Wilson, ESA SP, 604, 165 [NASA ADS] [Google Scholar]
- Paizis, A., & Sidoli, L. 2014, MNRAS, 439, 3439 [NASA ADS] [CrossRef] [Google Scholar]
- Romano, P. 2015, J. High Energy Astrophys., 7, 126 [NASA ADS] [CrossRef] [Google Scholar]
- Romano, P., Bozzo, E., Mangano, V., et al. 2015, A&A, 576, L4 [NASA ADS] [CrossRef] [EDP Sciences] [Google Scholar]
- Sguera, V., Barlow, E. J., Bird, A. J., et al. 2005, A&A, 444, 221 [NASA ADS] [CrossRef] [EDP Sciences] [Google Scholar]
- Sguera, V., Bazzano, A., Bird, A. J., et al. 2006, ApJ, 646, 452 [NASA ADS] [CrossRef] [Google Scholar]
- Sguera, V., Sidoli, L., Bird, A. J., & Bazzano, A. 2015, MNRAS, 449, 1228 [NASA ADS] [CrossRef] [Google Scholar]
- Sidoli, L., & Paizis, A. 2018, MNRAS, 481, 2779 [NASA ADS] [CrossRef] [Google Scholar]
- Staubert, R., Trümper, J., Kendziorra, E., et al. 2019, A&A, 622, A61 [NASA ADS] [CrossRef] [EDP Sciences] [Google Scholar]
- Ubertini, P., Lebrun, F., Di Cocco, G., et al. 2003, A&A, 411, L131 [NASA ADS] [CrossRef] [EDP Sciences] [Google Scholar]
- Walter, R., Lutovinov, A. A., Bozzo, E., & Tsygankov, S. S. 2015, A&ARv, 23, 2 [NASA ADS] [CrossRef] [Google Scholar]
- Winkler, C., Courvoisier, T. J.-L., Di Cocco, G., et al. 2003, A&A, 411, L1 [NASA ADS] [CrossRef] [EDP Sciences] [Google Scholar]
All Tables
Spectral results obtained by fitting together the NuSTAR FPMA and FPMB data of IGR J17503–2636 (taken from 2018 August 22 at 11:01 to August 23 at 10:26 UT)).
All Figures
|
Fig. 1. Zoom of the JEM-X (upper panel) and IBIS/ISGRI (bottom panel) mosaic of the region around IGR J17503–2636 obtained by combining all publicly available data from 2018 August 10 at 15:50 to 2018 August 11 at 18:52. The source is detected at a significance of 7σ in the IBIS/ISGRI mosaic and 6σ in the JEM-X mosaic. |
| In the text | |
|
Fig. 2. Unfolded JEM-X1 (red), JEM-X2 (green), and IBIS/ISGRI (black) spectra obtained by integrating over all available data between 2018 August 10 at 15:50 and 2018 August 11 at 18:52. The best fit is obtained with an absorbed power-law model (see text for details). Residuals from the fit are shown in the bottom panel. |
| In the text | |
|
Fig. 3. NuSTAR FPMA light curves of IGR J17503–2636 in the 3–10 keV and 10–60 keV energy bands (upper panels) and the hard-to-soft ratio (HR, bottom panel). The light curves have been rebinned in order to achieve S/N ≳ 10 in each time bin of the soft energy band. |
| In the text | |
|
Fig. 4. Power spectral density of the NuSTAR summed light curve in the 3–60 keV energy range binned at 0.005 s. The power spectrum was obtained by averaging 15 segments of 524288 bins and rebinned geometrically with a factor of 0.05. |
| In the text | |
|
Fig. 5. Unfolded FMPA (black) and FMPB (red) spectra of IGR J17503–2636 extracted using the entire exposure time available within the observation ID 90401333002. Right panel: results for the fit obtained with the model TBabs*(highecut*pegpwrlaw + Gaussian + Gaussian), while left panel corresponds to the case where the model TBabs*(highecut*pegpwrlaw*gabs + Gaussian) was used. In both cases, the residuals from the fits are shown in the bottom panels. |
| In the text | |
|
Fig. 6. Swift/XRT light curve of IGR J17503–2636 as obtained from the two available observations. The bin time is 100 s and the light curve has been corrected for the background, as well as all instrumental effects (0.5–10 keV). |
| In the text | |
|
Fig. 7. Swift/XRT spectra extracted from the observations ID 00010807001 (black) and 00088805001 (red). The best fit model is shown with solid lines in the upper panel, while residuals from the best fit are reported in the bottom panel. We used the XSPEC option setplot rebin 5 5 for plotting purposes. |
| In the text | |
|
Fig. 8. NICER spectra extracted from the observations ID 1200320101 (black) and 1200320103 (red). The best fit model is shown with solid lines in the upper panel, while residuals from the best fit are reported in the bottom panel. We used the XSPEC option setplot rebin 5 5 and removed empty bins for plotting purposes. |
| In the text | |
Current usage metrics show cumulative count of Article Views (full-text article views including HTML views, PDF and ePub downloads, according to the available data) and Abstracts Views on Vision4Press platform.
Data correspond to usage on the plateform after 2015. The current usage metrics is available 48-96 hours after online publication and is updated daily on week days.
Initial download of the metrics may take a while.