Free Access
Fig. 3.
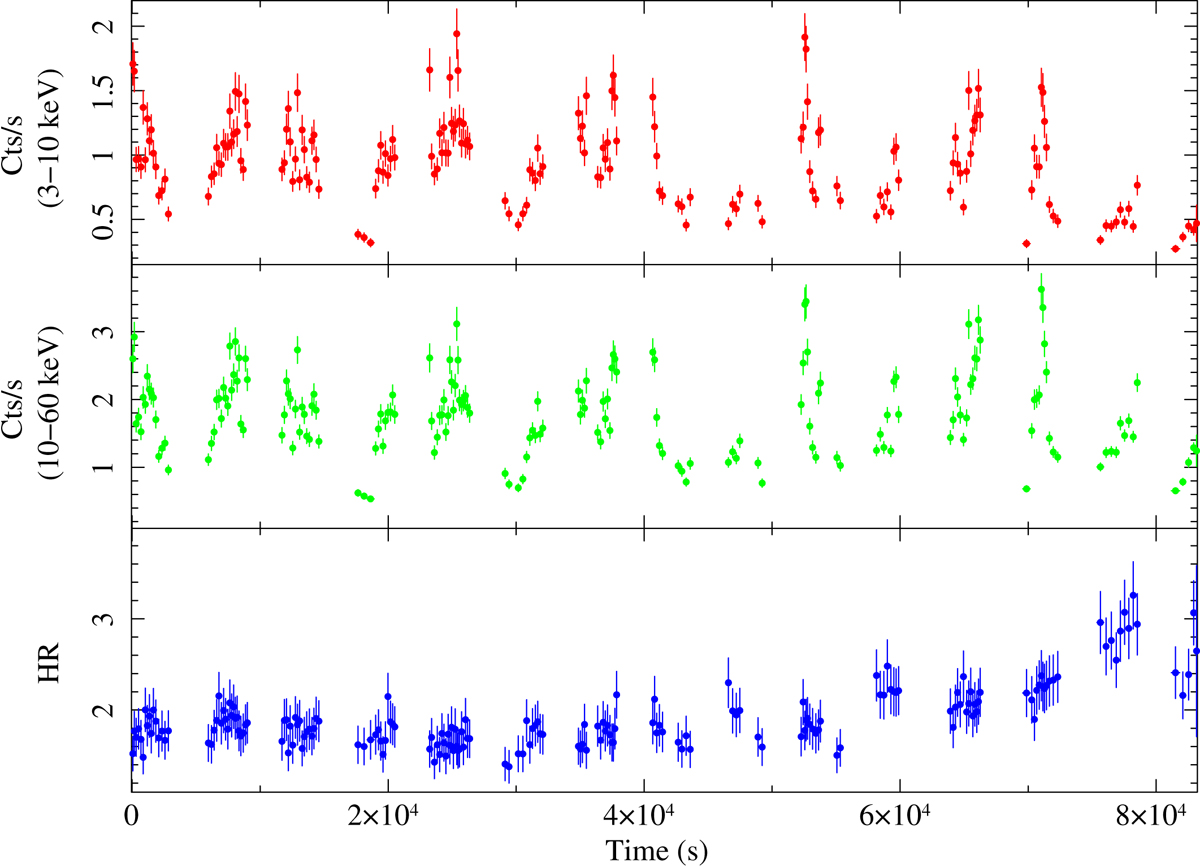
NuSTAR FPMA light curves of IGR J17503–2636 in the 3–10 keV and 10–60 keV energy bands (upper panels) and the hard-to-soft ratio (HR, bottom panel). The light curves have been rebinned in order to achieve S/N ≳ 10 in each time bin of the soft energy band.
Current usage metrics show cumulative count of Article Views (full-text article views including HTML views, PDF and ePub downloads, according to the available data) and Abstracts Views on Vision4Press platform.
Data correspond to usage on the plateform after 2015. The current usage metrics is available 48-96 hours after online publication and is updated daily on week days.
Initial download of the metrics may take a while.