Free Access
Fig. 8.
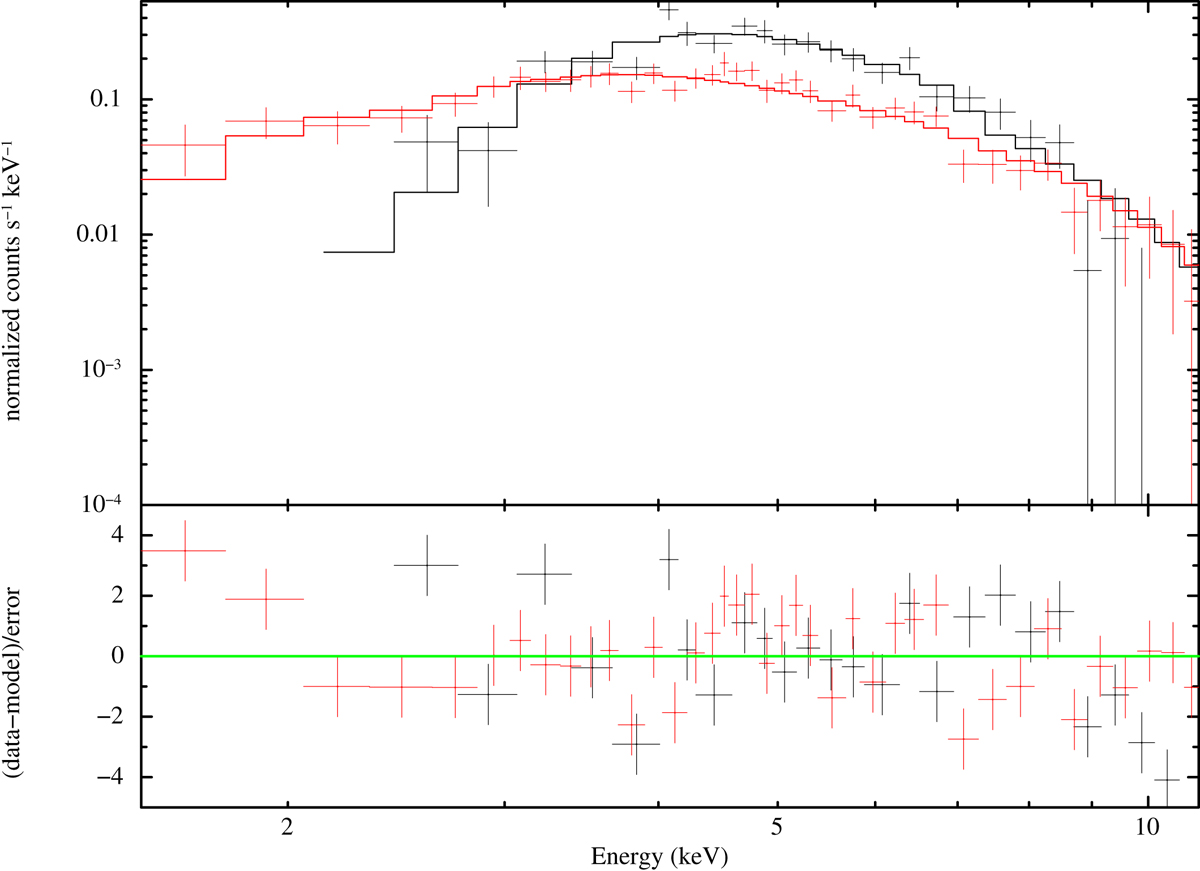
NICER spectra extracted from the observations ID 1200320101 (black) and 1200320103 (red). The best fit model is shown with solid lines in the upper panel, while residuals from the best fit are reported in the bottom panel. We used the XSPEC option setplot rebin 5 5 and removed empty bins for plotting purposes.
Current usage metrics show cumulative count of Article Views (full-text article views including HTML views, PDF and ePub downloads, according to the available data) and Abstracts Views on Vision4Press platform.
Data correspond to usage on the plateform after 2015. The current usage metrics is available 48-96 hours after online publication and is updated daily on week days.
Initial download of the metrics may take a while.