| Issue |
A&A
Volume 624, April 2019
|
|
|---|---|---|
| Article Number | A72 | |
| Number of page(s) | 13 | |
| Section | The Sun | |
| DOI | https://doi.org/10.1051/0004-6361/201834259 | |
| Published online | 12 April 2019 | |
Launch of a CME-associated eruptive prominence as observed with IRIS and ancillary instruments⋆
Institut d’Astrophysique Spatiale, CNRS/Université Paris-Sud, Université Paris-Saclay, Bâtiment 121, Université Paris-Sud, 91405 Orsay Cedex, France
e-mail: ping.zhang@ias.u-psud.fr
Received:
17
September
2018
Accepted:
14
February
2019
Aims. In this paper we focus on the possible observational signatures of the processes which have been put forward for explaining eruptive prominences. We also try to understand the variations in the physical conditions of eruptive prominences and estimate the masses leaving the Sun versus the masses returning to the Sun during eruptive prominences.
Methods. As far as velocities are concerned, we combined an optical flow method on the Atmospheric Imaging Assembly (AIA) 304 Å and Interface Region Imaging Spectrograph (IRIS). Mg II h&k observations in order to derive the plane-of-sky velocities in the prominence, and a Doppler technique on the IRIS Mg II h&k profiles to compute the line-of-sight velocities. As far as densities are concerned, we compared the absolute observed intensities with values derived from non-local thermodynamic equilibrium radiative transfer computations to derive the total (hydrogen) density and consequently compute the mass flows.
Results. The derived electron densities range from 1.3 × 10⁹ to 6.0 × 1010 cm−3 and the derived total hydrogen densities range from 1.5 × 10⁹ to 2.4 × 1011 cm−3 in different regions of the prominence. The mean temperature is around 1.1 × 10⁴ K, which is higher than in quiescent prominences. The ionization degree is in the range of 0.1–10. The total (hydrogen) mass is in the range of 1.3 × 10¹⁴–3.2 × 10¹⁴ g. The total mass drainage from the prominence to the solar surface during the whole observation time of IRIS is about one order of magnitude smaller than the total mass of the prominence.
Key words: Sun: filaments, prominences / Sun: coronal mass ejections (CMEs) / techniques: spectroscopic
The movie associated to Fig. 2 is available at https://www.aanda.org
© P. Zhang et al. 2019
 Open Access article, published by EDP Sciences, under the terms of the Creative Commons Attribution License (http://creativecommons.org/licenses/by/4.0), which permits unrestricted use, distribution, and reproduction in any medium, provided the original work is properly cited.
1. Introduction
The issues of formation, stability, and eruption of solar prominences are very actively explored for many reasons ranging from the unanswered questions they raise in plasma physics to space weather aspects because of the close link between prominence eruptions (PEs), flares, and coronal mass ejections (CMEs); a recent overview can be found in Vial & Engvold (2015). Obviously, the three issues are connected but correspond to very different lifetimes, which span a few hours or days (formation) or months (stability), to a few hours (eruption). In the latter case, thorough studies have been made difficult by the short duration and the unpredictability of the event. However, much progress has been made in the last decades with the advent of both synoptic (continuous) measurements from space (with the Extreme ultraviolet Imaging Telescope (EIT) onboard the Solar and Heliospheric Observatory (SOHO), the Atmospheric Imaging Assembly (AIA) telescope onboard the Solar Dynamics Observatory (SDO) and the Extreme-Ultraviolet Imagers (EUVI) on the Sun-Earth Connection Coronal and Heliospheric Investigation (SECCHI) suite of telescopes onboard the Solar Terrestrial Relations Observatory (STEREO)) and multiwavelength spectroimaging. Equally fast progress has been made in the domain of magnetohydrodynamics (MHD), magnetic field extrapolation and modeling (see Chapters 12 Fan 2015, 13 Gibson 2015, 15 Gopalswamy 2015, and 16 Webb 2015 of the above-mentioned book Vial & Engvold 2015). In the following, we focus on the possible signatures of the processes that have been put forward to explain PEs.
Following Fan (2015), one can categorize the various models of PEs into two classes: current-aligned (force-free) models with increasing twist, and massive models where gravity no longer counterbalances magnetic pressure when, for example, mass is removed. In the first case, flux emergence may be at work and its signature is a magnetic flux rope (MFR) compatible with the observed “inverse polarity” at the prominence inversion line (PIL). However, flux emergence is rather slow (with a velocity on the order of the photospheric velocities, a few kilometers per second) and is at odds with the observed fast eruption. This contradiction is removed with two different processes: ideal (kink and torus) instabilities, and reconnection. The kink instability is initiated when the twist is above a critical value (e.g., 1.25 rotation according to Hood & Priest 1981). The torus instability starts when the MFR is no longer confined (Titov & Démoulin 1999), which occurs above a critical height of about 15 000 km. In any case, the main question is how to transition from the quasi-static build-up to the dynamic eruptive phase.
An obvious possibility is offered by flux emergence with shearing and twisting motions (Chatterjee & Fan 2013) in the slow activation phase and flux cancellation at the PIL. It is supported by MHD simulations of flux rope eruption (Aulanier et al. 2010). Clearly the signature of these motions (periodic sign changes of velocities) can only be obtained through pixel-to-pixel spectroscopy.
A possible signature of these shearing and twisting motions is the altitude at which the decay index of the potential field reaches 1.5–1.7 when acceleration takes place (e.g., McCauley et al. 2015 who find a mean altitude of 83 Mm). Fan (2012) also addresses the thermal signatures of “tether-cutting” reconnections: the formation of a hot central low-density channel below the flux rope and above the vertical current sheet (CS). The break-out model (Kumar et al. 2018) explains the CME onset and the CME acceleration with two CSs: the break-out CS (on top, horizontal) and the flare CS (at the bottom, vertical). Such CSs should have signatures in imaging and spectroscopy. The existence of cavities (Gibson 2015) leads to questions concerning the Kelvin-Helmholtz and Rayleigh-Taylor mechanisms, and about the mass exchanges between the chromosphere and the corona, where the daily cycle could involve a mass an order of magnitude larger than the total mass, maintained for days or weeks (Liu et al. 2012, and subsequent papers).
The correlation between PEs and CMEs is well established, even at the scale of activity cycles. The material of the cool core of CMEs (noticed as early as 1977 with a temperature of 20 000 K at 3 R⊙ by Schmahl & Hildner 1977) can only be provided by the erupting prominence (see also Giordano et al. 2013; Heinzel et al. 2016). Moreover, the cool and hot materials follow the same trajectory with about the same velocities (Gopalswamy 2015). Finally the masses involved (1.6 × 10¹² kg for a CME, and typically 1.6 to 16 × 1012 kg for a PE, Webb 2015) imply that PEs are potential providers of mass to the associated CME. This leads to a critical evaluation of the masses leaving the Sun versus the masses returning to the Sun (Howard & Vourlidas 2018), an endeavor that requires imaging spectroscopy on long durations over a large field of view (FOV).
Considering the above-mentioned requirements, we analyzed a fairly complete set of observations of an eruptive prominence observed on May 28, 2014 at the west limb, which include the Interface Region Imaging Spectrograph (IRIS), SDO, STEREO, SOHO and ground-based observatories (such as the K-coronagraph (K-COR) operating at the High Altitude Observatory (HAO)). We introduce the observations and the instruments used in Sect. 2. Section 3 details our computation and analysis of the velocity pattern in the prominence. Section 4 contains the diagnostics of the prominence plasma and the distributions of the density and temperature in the prominence. In Sect. 5 we present the results of the mass flows in the prominence. Section 6 includes our concluding remarks on this work.
2. Observations
On 2014 May 28 an erupting prominence occurred near the north-west limb of the Sun. Slow rising motions started around 14:00 UT, the prominence eruption started around 18:00 UT, with a leading edge speed of 30 km s−1. During the eruption, there were untwisting motions, and material was ejected upwards and at the same time fell back to the Sun. The front of a CME was observed by SOHO/LASCO C2 at 21:36 UT, with a maximum plane-of-sky (POS) speed of 330 km s−1. No flare was observed around this region during the activation and eruption of the prominence. Table 1 shows the summary of observations.
Summary of observations on May 28, 2014.
IRIS. The Interface Region Imaging Spectrograph (IRIS, De Pontieu et al. 2014) was running very large sparse 64-step rasters with a spatial resolution of 1″ perpendicular to the slit, 0.33″ along the slit, a temporal resolution of 16.2 s, and a maximum FOV of 230″ × 175″. The observation of the prominence started at 11:25 UT and lasted about two and a half hours. It covered the activation of the prominence, which started around 14:00 UT. The IRIS slit was oriented almost perpendicular to the central axis of the eruption, and covered the lower portion of the prominence, as shown in Fig. 1a. Simultaneously spectra in UV C II, Mg II k and h, and Si IV lines (exposure time 15 s) were taken along the slit, seen as a dark line at the center of the slit-jaw images (SJI). Figure 1b shows the mean Mg II k and h spectra averaged over the position marked in red in Fig. 1a.
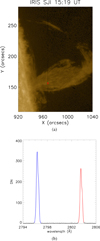 |
Fig. 1. Panel a: IRIS slit-jaw image in 1400 Å, the dark line in the center corresponds to the position of the slit. Panel b: Mg II k&h spectra observed at the position marked in red on the slit in the SJI image. |
SDO/AIA. Simultaneous full-disk He II 304 Å observations with 1 min cadence were made by the Atmospheric Imaging Assembly (AIA, Lemen et al. 2012) of the Solar Dynamics Observatory (SDO, Pesnell et al. 2012), together with six other extreme ultraviolet (EUV) spectral channels. The He II 304 Å channel was chosen as being sensitive to chromosphere and transition region temperatures, and thus most representative of the cool prominence material. The AIA FOV reaches 1.3 solar radii with a spatial resolution of about 1.5″. The observed prominence was located at the NW limb and crossed the limb before the activation. The top of the prominence went out of the FOV during the eruption at 19:20 UT. Figure 2 shows AIA images observed in the He II 304 Å channel at different times before and during the eruption.
 |
Fig. 2. Images obtained by SDO/AIA in the He II 304 Å line at different times before (left panel) and during the prominence eruption (middle, right panels). These images are part of a movie available online. |
STEREO/SECCHI. We also analyzed observations from the Extreme Ultraviolet Imager (EUVI) onboard the STEREO A and B spacecraft (Wülser et al. 2004). EUVI has a FOV of 1.7 R⊙ and observes in four spectral channels (He II 304 Å, Fe IX/X 171 Å, Fe XII 195 Å, and Fe XIV 284 Å) that cover the 0.1–20 MK temperature range. We used images in the He II 304 Å channel with a cadence of 10 min to 2 h. On May 28 2014, the separation angles with Earth were 164.7° and −159.2° for the STEREO A and B spacecraft respectively, thus they provided observations of the prominence from different viewpoints, as shown in Fig. 3.
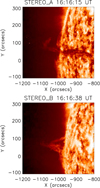 |
Fig. 3. Images obtained by the EUVI instrument on board STEREO A at 16:16:15 UT (panel a) and STEREO B at 16:16:38 UT (panel b) in the He II 304 Å channel. |
HAO/K-COR. We also analyzed observations from the K-coronagraph (K-COR) operating at the High Altitude Observatory (HAO). K-COR has a FOV of 1.05 to 3 R⊙ and observes in the 720 to 750 nm passband. The prominence and subsequent CME was observed by K-COR between 17:14 and 21:18 UT with a spatial resolution of 5.5″ and cadence of 15 s. To identify the location of coronal structures, high contrast images were derived by Joan Burkepile, who applied a normalized radially graded filter (Morgan et al. 2009, adapted by S. Fineschi and S. Gibson for K-COR), as shown in Fig. 4. In this way we can track the twisted prominence while it moves outward. And a narrow cavity was observed after 19:40 UT, as shown in Fig. 4b.
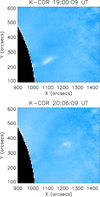 |
Fig. 4. K-COR images taken at 19:00 UT (panel a) and 20:06 UT (panel b) on May 28 2014, provided courtesy of J. Burkepile. |
SoHO/LASCO. Images obtained by the Large Angle and Spectrometric Coronagraph (LASCO)/C2 onboard SoHO were also analyzed. The FOV extends from two to six solar radii (Brueckner et al. 1995). The front of a CME was observed by LASCO C2 from May 28, 21:36 UT to May 29, 01:25 UT, and the maximum velocity of the CME reached 332 km s−1 according to the CACTUS catalog (Robbrecht et al. 2009)1.
3. Data analysis
3.1. Prominence morphology and geometry evolution
This filament is part of the remnant of active regions AR 12017 and AR 12018. It had been visible nearly throughout the disk passage of the active regions, which were in their decaying stage, and it disappeared on the other side of the Sun based on STEREO A and B observations. The observed filament was close to disk center on May 21. It was S-shaped and the main direction was along parallels of solar longitude, as seen in Fig. 5. Then it rotated towards the NW limb and crossed the limb several days before the eruption onset. Since we roughly see the prominence “head-on” before the eruption, it is difficult to distinguish its small-scale structures. During the activation and eruption of the prominence, there is material falling down from the top of the prominence as shown in Fig. 2, probably along the magnetic field lines. The observed downflows are first at the south of the main part, then at the north of the main part; this could be a projection effect of the S structure at the limb. In the AIA movie of the eruption, we see an apparent clockwise untwisting motion of the filament body from 18:30 until around 21:00 UT. At the same time, the eruption appears to propagate inclined by 9 to 20° from the radial direction toward north. The inclination makes it difficult to discern rotational motions based on images from only a single viewpoint.
 |
Fig. 5. He II 304 Å image of the filament on May 21, 2014 taken by AIA/SDO. |
EUVI onboard the STEREO A and B spacecraft provide observations of the prominence from different viewpoints, as shown in Fig. 3. Using the Interactive Data Language (IDL) program scc_measure.pro in the SolarSoftWare (SSW) package, we reconstructed the 3D coordinates of the prominence. The tie-pointing method that is used to locate the position of solar structures in two images from two different spacecraft is described by Thompson (2009). We find that the main body of the prominence is behind the limb as seen from Earth, as evidenced by Fig. 3. The top of the prominence is located close to the POS, and its Stonyhurst heliographic longitude and latitude are 89.0° and 10.6° respectively. The inclination angle between the prominence motion axis and the POS is around 60° close to the top of the prominence at 16:16 UT. The separation of the two STEREO spacecraft at this time was 36°, but the cadence of the observations especially for STEREO B (2 h) is insufficient to follow the eruption in 3D.
We also tried to reconstruct the 3D coordinates of the prominence with the observations of SDO and STEREO A. The separation of the two spacecraft at this time was 159°. Co-identification of features in both views is quite difficult with such a large separation. However, it is possible to match some sharp features in the later part of the eruption. Figure 6 shows the tracked features as seen in the 304 Å channel of AIA/SDO. The plots in Fig. 7 show the Stonyhurst heliographic longitudes and latitudes of the feature tracked at each time step, as derived from SDO and STEREO A. The tracked feature evolved around Stonyhurst longitude 100° west, and 15° north. The primary alignment of the 20:06 UT plot is along parallels of longitude, west to east from bottom to top. However, in the later plots the tracked feature distinctly inclines toward a higher latitude. The plot at 20:16 displays a slope of 15°, and the plot at 20:26 UT displays a slope of 120° in Fig. 7. Furthermore, a counterclockwise rotation in this plot (corresponding to an counterclockwise rotation of the structure as seen from above) can be perceived from 20:06 to 20:26 UT. We also tracked the threads falling from the top of the prominence by this method, and the radius of a bunch of threads is about 5000 km when the threads are assumed to be cylindrical.
 |
Fig. 6. Prominence observed by AIA in the He II 304 Å channel at 20:06 (left panel), 20:16 (middle panel), and 20:26 UT (right panel). The plus (+) symbols indicate the features tracked at different times and matched to features seen with STEREO A. |
 |
Fig. 7. Stonyhurst heliographic longitudes and latitudes of the feature tracked at 20:06 (red), 20:16 (blue), and 20:26 UT (green). Indices 1 and 6 correspond respectively to the top and bottom panels of the feature in Fig. 6. |
3.2. Velocities in the prominence
3.2.1. Velocity of the top of the prominence
The prominence heights are determined as the position of the top along the main axis of the prominence above the visible limb as observed in the IRIS SJIs, AIA images, and K-COR images (Fig. 8). The time evolution of the height begins with prominence activation, then follows an eruption with acceleration. The prominence activation begins around 14:00 UT, when it is observed by IRIS and AIA. The heights of the top tracked in AIA and IRIS images are consistent with each other at the same time. Then the top of the prominence moves out of the IRIS FOV at 15:26 UT, and the activation ends around 18:00 UT. During this period, the top of the prominence rises with a slow velocity of about 4 km s−1. The eruption acceleration begins around 18:00 UT and it is determined from the AIA images as a sudden increase of the prominence height. The top of the prominence reaches the of AIA FOV boundary around 19:10 UT. Afterwards it is continuously tracked in K-COR images in white light, although this does not necessarily correspond to the same features as seen in the 304 Å channel. We can track the top of the prominence in K-COR images until around 21:00 UT, when the speed of the prominence rise reaches 42 km s−1; afterwards it is too diffuse to track. Then the front of a CME is observed by LASCO C2 at 21:36 UT, it crosses the FOV of C2, and reaches the maximum velocity of 332 km s−1 at 01:25 UT on May 29.
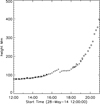 |
Fig. 8. Altitude of the top of the prominence tracked in IRIS (*), SDO/AIA (+), and K-COR (⋄). |
3.2.2. Plane of sky velocities
We obtained the velocities in the plane of sky (POS) by using the Farnebäck (2003) optical flow algorithm provided by the OpenCV library (Bradski 2000) through its Python interface, with a window size parameter of 20 pixels, which puts a limit on the resolution of the output velocity field. Figure 9 shows the POS velocity streamlines (right of each panel) derived by applying the optical flow algorithm on AIA images (left of each panel) at 15:17 (top) and 19:34 UT (bottom), respectively. At 15:17 UT, downward motions with a velocity smaller than 5 km s−1 are generally observed in the lower part of the prominence, while in the upper part of the prominence upward motions are derived with a velocity on the order of 8 to 15 km s−1. At 19:34 UT horizontal motions parallel to the solar surface toward high latitudes are observed in the body of the prominence with a velocity between 5 and 10 km s−1. They indicate that the prominence propagates inclined from the radial direction toward higher latitudes. The velocities of the prominence top at 15:17 and 19:34 UT are on the order of 5 to 20 km s−1. They are consistent with the results of prominence top tracking (Sect. 3.2.1).
 |
Fig. 9. POS velocity (right of each panel) derived from AIA image pairs (left: first image of each pair) using the Farnebäck optical flow algorithm at 15:17 (panel a) and 19:34 UT (panel b). The color indicates the value of velocity, the arrows indicate its direction, and the thickness is related to the observed intensity in AIA. |
3.2.3. Doppler velocities
Mg IIline profiles. The spatially-resolved spectra of Mg II k&h lines show a wide range of profiles in the prominence. The profiles of the Mg II k line from the main body of the prominence are mainly non-reversed, while in the lower part of the prominence there are reversed profiles with distinct red and blue peaks. In the prominence, we also find profiles that have more than two peaks, which indicate a combination of different structures with different velocities along the LOS. Based on the main characteristics of the profiles, we divide the profiles from the prominence into three groups: A) single-peaked profiles, B) central-reversed profiles, and C) complex profiles that may have more than two peaks, or that have two peaks and the distance between the two peaks is larger than 0.5 Å.
Figure 10a shows the spatial distribution of the three groups of profiles in the prominence, as derived from IRIS spectral observations between 15:10 and 15:27 UT, with pixel size degraded to 1″ × 1″. Out of all the 2700 profiles in the prominence, about 60 % belong to group A, 14 % belong to group B, and 26 % belong to group C. Figure 10b shows a sample set of Mg II k spectra obtained by averaging the profiles in regions marked with the “×” symbols in regions corresponding to these groups in Fig. 10a. We note that the single-peaked profile (A) has a full width at half maximum (FWHM) of 0.2 Å, indicating a turbulence velocity less than 9 km s−1. The central-reversed profile (B) has a larger red peak and a FWHM of 0.45 Å. The complex-type profile (C) is taken close to the boundary of a region with POS vortical-type motions; it is mainly composed of three independent components, among which the blue-shifted component centers at about 22 km s−1 and the two red-shifted components center at about 42 km s−1 and 82 km s−1 respectively. The combination of the different structures moving with opposite-sign velocities along the LOS forms a pattern of counter-streaming flows in this region. Both the red-shifted and blue-shifted components still exist in the original profiles (before averaging), possibly indicating a pattern of counter-streaming flows (see Zirker et al. 1998) in this region.
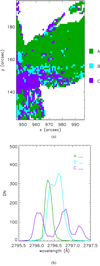 |
Fig. 10. Panel a: spatial distribution of the three groups of profiles in the prominence in different colors derived from IRIS spectral observations between 15:10 and 15:27 UT. Panel b: a set of samples of Mg II k spectra obtained by averaging the profiles of pixels marked with red “×” symbols in the areas with corresponding colors in panel a. |
Determination of Doppler velocities. We derived the Doppler velocity in the prominence by comparing the line core of the profiles with an off-limb reference wavelength for Mg II k&h lines. The reference wavelength was obtained by averaging the line profiles measured in a large quiet region above the west limb where the spectral line is expected to be close to its rest wavelength, because there we measure the disk emission scattered by the telescope. To extract the positions of the line core automatically, first we used the method developed by Leenaarts et al. (2013), which is designed for single- or double-peaked profiles. This method starts by using an extremum-finding algorithm on a small spectral region (−40 < v < 40 km s−1) around the reference wavelength and derives the wavelengths of all maxima and minima in each line-core spectrum. Then a parabolic fit is made to yield the line-center velocity.
Figure 11 shows a map of the Doppler velocities obtained from IRIS spectral observations between 15:10 and 15:27 UT, while the slit scans the lower part of the prominence in 64 steps. Negative velocities correspond to blueshifts and indicate horizontal motions (parallel to the solar surface) moving towards the observer. We find that the central part of the prominence, where mainly single-peaked profiles (A) are located, is dominated by red-shifted strands. The velocity in the central part of the red-shifted, elongated strands, whose sizes normal to the main axis are between 5 and 8″, is between 10 and 20 km s−1. Several blue-shifted cells, whose cross-sections are around 2″, are distributed between the red-shifted strands. In the central part of these blue cells, the velocity is between 5 and 10 km s−1. Most of the complex profiles (C) are located at the prominence edges. This region is dominated by blue shifts, as shown in Fig. 11, with a velocity between 15 and 25 km s−1.
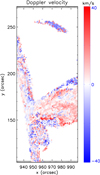 |
Fig. 11. Doppler shifts computed from the extremum-finding of the Mg II k&h line profiles between 15:10 and 15:27 UT. The pixel size in the y direction has been degraded to 1″ to have square pixels. |
However, the large variation of the complex shapes of the type C profiles introduces uncertainties when applying the extremum-finding algorithm in our analysis, especially when the profile is composed of several independent components caused by the presence of different structures along the line of sight, as shown in Fig. 10b. Furthermore, in the boundary region of the prominence, where the signal is lower and line profiles are noisy, it is difficult to get robust features in the spectra with the extremum-finding method. In these cases, the gravity center of the whole profile could represent better the mean velocity of all the components of the profile.
Figure 12 shows the Doppler shift map computed from the gravity center of the Mg II k&h line profiles. The velocity pattern is similar to the one derived with the extremum-finding method in the central part of the prominence, where there are three long red-shifted strands and several blue cells in between, while at the north and south edges, red shifts are derived instead of blue shifts. The velocity is between 25 and 65 km s−1 in these regions. Such values seem to be typical of prominence edges, as derived from Hα by Mein (1977) or Mg II h&k by Vial et al. (1979). The difference between these two methods at the southern boundary where type C profiles dominate mainly comes from the complex shapes of the profiles. For instance, from the type C profile in Fig. 10b, which is composed of one blue-shifted and two red-shifted components as an example, a blue shift of 22 km s−1 is derived with the extremum-finding method, as only the blue component close to the rest wavelength is taken into account; in contrast, a red shift of 25 km s−1 is derived from the gravity center of the whole profile. We also computed the Doppler shift from gravity centers for all the 16 consecutive rasters. The derived trend of velocity pattern evolves only slightly during the whole observation time, except when several small red-shifted cells become blue-shifted, and vice versa.
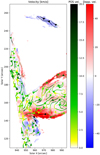 |
Fig. 12. Composite velocity map derived from IRIS spectral and SJI observations between 15:10 and 15:27 UT. Doppler velocity is shown in the background with the red-blue colorbar. Negative velocities indicate horizontal motions moving towards the observer (blueshifts). Streamlines show the direction of the POS velocity, their color give the value of the POS velocity, and their thickness is related to the observed intensity in IRIS SJI. |
3.2.4. Velocity vectors from IRIS
We also derived the POS velocity in the IRIS FOV by applying the optical flow algorithm mentioned above on IRIS SJI images taken between 15:10 and 15:27 UT. Afterwards we combined the velocities from different SJIs taken at times corresponding to different slit positions to obtain a POS velocity map that is consistent with the Doppler velocity map in time and space. The streamlines of the derived POS velocity are overplotted in Fig. 12, giving a visualization of 3D velocity vectors in the prominence. We find that downflows dominate the lower part of the prominence with a velocity less than 20 km s−1 during the whole observing time of IRIS. As from the 3D reconstruction (Sect. 3.1), the observed prominence body is located behind the POS, and the inclination angle between the prominence motion axis and POS is around 60° at 16:16 UT, the redshift in the prominence may be caused by downward motions. In Fig. 12, we find that Doppler redshifts of strands could be the LOS components of the POS downflows. The ratios of Doppler velocities to downflow velocities vary from 1 to more than 3 in the red-shifted strands. This result is consistent with the 3D geometry of the prominence. Besides, we found that some red-shifted cells became blue-shifted, and vice versa, over the period of observation. This may indicate the untwisting motions of the structure. In the upper part of this panel, away from the prominence body, there is a blue-shifted strand away from the prominence body with a POS velocity of 25 km s−1. It could correspond to a clump of coronal rain material falling from the prominence along the field lines, toward the observer.
3.3. Radiometric calibration
If we want to derive mass flows from the POS velocities, we first need the absolute intensity in the Mg II k&h profiles to compute densities. The photometric calibration is consequently an important task in this analysis. In our analysis, we used IRIS level 2 data with dark current and flat-field correction, as well as geometric and wavelength calibration (De Pontieu et al. 2014). The data is given in data number units (DN) and we performed a radiometric calibration using iris_get_response.pro (version 4) on all data of the prominence observation to convert them to a specific intensity in physical units (e.g. erg s−1 sr−1 cm−2 Å−1). The results from this calibration procedure are labeled IRESP.
We investigated another calibration procedure to have a better knowledge of the uncertainty of radiometric calibration: this second procedure is similar to that used by Vial et al. (2016), and consists in considering the quiet Sun as a reliable and stable calibration source. We compared the high-resolution Mg II profiles obtained on disk and in the prominence with the calibrated (photoelectric) values of Kohl & Parkinson (1976), which were obtained during a minimum of solar activity. These authors essentially provide intensities at different positions in the k and h profiles (from k1v to h1r) along with the total intensity in the integrated profiles at two solar positions (Sun center and μ = 0.23). Although our measurements took place during a (weak) peak of activity during Cycle 24, we tentatively compared our quiet Sun measurements with those of Kohl & Parkinson (1976). We chose to use the IRIS observations performed at disk center on May 29, 2014. The results from this calibration procedure are labeled KP.
The comparison between the spectra calibrated with both methods (IRESP and KP, Fig. 13) shows that the KP values and the IRESP values are consistent with each other: The IRESP values are a bit higher than the KP values, but the difference is less than 5% across the whole spectral range. The integrated intensities derived from IRESP values are 3.5 × 10⁴ and 2.5 × 10⁴ erg s−1 sr−1 cm−2 Å−1) for the Mg II k and h lines respectively.
 |
Fig. 13. Calibrated profiles obtained at the position in red in Fig. 1. Red curve: IRESP calibration method. Green curve: calibration method using the quiet-Sun values of Kohl & Parkinson (1976) as references. |
3.4. Mg k/h ratio
We also computed the intensity ratio of the Mg II k and h lines by identifying the corresponding components in both lines and integrating their intensities. The intensity ratio is a simple and useful tool for plasma diagnostics and can be used to investigate their opacity. Under the optically thin assumption in a collision-dominated plasma, the k/h ratio is simply the ratio of the oscillator strengths, 2:1 (Mathioudakis et al. 1999; Çelik et al. 2011). In the optically thick case, this ratio is smaller. Figure 14 shows a map of this ratio in the prominence derived from the IRIS spectral raster scan between 15:10 and 15:27 UT. It shows that the k/h ratio is larger than 1.35 in the prominence and it is generally around 1.4 in its main body. This value roughly corresponds to the ratio of incident intensities of 1.28, which further indicates that the medium is optically thick and radiation dominated. Similar values have been reported in previous observations. Heinzel et al. (2014) and Schmieder et al. (2014) derived 1.33–1.35 for quiescent prominences observed by IRIS. Liu et al. (2015) found a wide range of k/h ratios in an erupting prominence; the lowest ever-reported median value of 1.17 corresponds to material falling back while a higher value of 1.63 was found in a nearby coronal rain. The intermediate values of 1.53 and 1.41 were found in two eruption components. We also derived k/h ratios up to 1.7 to 2.0 in regions close to the edges, where Doppler redshifts are relatively larger. This is perhaps an indication that the medium is not so thick and has a higher (relative) collisional contribution resulting from a higher temperature close to the edges.
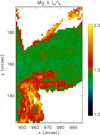 |
Fig. 14. Map of the Mg II k/h intensity ratio in the prominence derived from an IRIS spectral observation between 15:10 and 15:27 UT. |
4. Diagnostics of density, temperature, and ionization degree
We performed plasma diagnostics by comparing Mg II h&k integrated intensities from IRIS observations and from the non-local thermodynamic equilibrium (NLTE) radiative-transfer code PROM72. The prominence structure in this model consists of one-dimensional (1D) isothermal and isobaric plasma slabs vertically standing on the solar surface and irradiated by photospheric and chromospheric radiation. The input parameters of this code include gas pressure, temperature, the height above the solar surface, geometrical thickness of the 1D slab, and the microturbulent velocity. The outputs are physical quantities and optical parameters like electron density, the total hydrogen density, Mg I, II, and III ground state populations, the total intensity of H lines and Mg II lines, and the optical thickness in H and Mg II lines. More details of this code are presented in Vial et al. (2019).
As the incident radiation intensities have a great importance for this kind of computation, we calculated the absolute radiation intensity from an IRIS full-disk mosaic observation taken from 10:06 UT on May 27 to 3:30 UT on May 28, assuming that the variation of solar radiation in Mg II k&h lines is negligible between the observing time of the mosaic observation and the prominence. This observation is transformed into Carrington coordinates, as shown in Fig. 15, and complemented with He II 304 Å data from STEREO A taken at 15:00 UT on May 28. The regions inside the red, green, and blue circles indicate where the incident radiation comes from at the heights of 10 000, 20 000, and 50 000 km over limb, respectively. There are no large active regions but only small bright fragments scattered inside these circles. Thus we calculate the incident radiation from the absolute intensity of the mosaic observation for heights lower than 20 000 km. For heights between 20 000 and 50 000 km, it is computed from the derived incident radiation at the height of 10 000 km by applying the geometric dilution factor as a function of height.
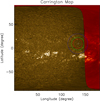 |
Fig. 15. Composite Carrington map of the solar hemisphere centered on 90° Carrington longitude, with the IRIS mosaic of 2014-05-27 (Mg II k radiance, yellow) and, behind the IRIS limb, He II 304 Å data from STEREO A taken at 15:00 UT on May 28 (in red). The regions inside the red, green, and blue circles indicate where the incident radiation comes from as seen from an altitude of 10 000, 20 000, and 50 000 km over the limb respectively, at the position of the prominence (+ symbol). |
To compare with observations, we built a grid of 1980 NLTE models (using the PROM7 code), covering a temperature range of 5000–15 000 K, a pressure range of 0.005–0.5 dyn cm−2, a height range of 10 000–50 000 km, and a turbulent velocity of 5 km s−1. The thickness is set to be 1000 km given that the cross sections of the small blue-shifted cells distributed between the red-shifted strands in Fig. 11 are about 1″–2″.
With the results of all models, we obtained a range of predicted line intensities (profiles and integrated intensities) changing with temperatures and pressures. We calculated Mg II h&k integrated intensities from IRIS spectral observations that have been binned to have square pixels of 1″ × 1″. Then we computed the deviation of Mg II h&k line intensities between observations and outputs of the models. We determined the optimum model for the observations by minimizing the RMS residuals of both intensities. Then we constructed the 2D density and temperature maps of the prominence by applying this method in each pixel of IRIS spectral observations. Figures 16–18 show how the electron density, total hydrogen density, and temperature are distributed in the prominence. The horizontal lines located around y = 145″ in these figures are fiducials that block the light from entering and are used for calibration. The derived electron densities range from 1.3 × 10⁹ to 6.0 × 1010 cm−3 and the derived total hydrogen densities range from 1.5 × 10⁹ to 2.4 × 1011 cm−3 in different regions of the prominence. The densities estimated in the previous studies (Labrosse et al. 2010; Gilbert et al. 2005) are similar to our values. The electron and hydrogen densities decrease at the edges of the prominence when assuming a constant effective thickness, and high density plasma is mainly located at the bottom of the prominence and extends along the main axis.
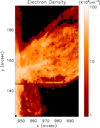 |
Fig. 16. Electron density in the prominence derived from IRIS spectral observations between 15:10 and 15:27 UT. |
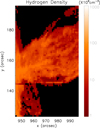 |
Fig. 17. Hydrogen density in the prominence derived from IRIS spectral observations between 15:10 and 15:27 UT. |
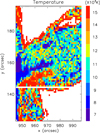 |
Fig. 18. Temperature in the prominence derived from IRIS spectral observations between 15:10 and 15:27 UT. |
We also have information on the electron density from the Far-Ultraviolet (FUV) lines. Here we focus on the Si IV doublet at 1394 and 1403 Å. The signal being very weak, we computed profiles averaged in space (over an area of about 10″ × 10″ in the lower part of the prominence) and in time (the 16 rasters). The resulting integrated intensities are respectively 36 and 16 erg s−1 sr−1 cm−2 for the two lines3. If we adopt a formation temperature of 7 × 10⁴ K (or log T = 4.8), we can derive an emission measure (EM) of about 8 × 1025 cm−5. Such a value leads to a squared density of 8 × 1017 cm−6 (when using the adopted thickness of 1000 km). The average density is consequently of 9 × 108 cm−3. When equaling the pressure between Mg II (T = 10 000 K) and Si IV formation (T = 7 × 10⁴ K) regions, one obtains electron density to be 7 × 109 cm−3, well in the range found from Mg II modeling (1.3 × 10⁹ to 6.0 × 1010 cm−3).
We also estimated electron densities in the prominence with K-COR white light observations, where the emission is mainly Thomson scattering in this wavelength range. The derived electron density is then about 7 × 109 cm−3 at the height of 55 000 km above limb around 17:00 UT when assuming a cylindrical geometry with an effective thickness of 1000 km. This density value coincides with the value derived from Si IV measurements and is also well within the range found from Mg II h and k modeling at an altitude of 50 000 km (1.3 × 10⁹ to 6.0 × 1010 cm−3).
Figure 18 shows the temperature distribution in the prominence during activation, derived from the grid of models at the same time as density. It is in the range of 7000–15 000 K. Labrosse & McGlinchey (2012) found similar values in erupting prominences using the intensity of the He II 304 Å resonance line. The temperature increases at the boundary between the prominence and corona in Fig. 18. No conspicuous pattern of temperature distribution is found where x > 980″. However, we find a low temperature region located along the axis and between the solar surface and the prominence, where we also find high density. The ionization degree was also computed from model results. The ratio of the number density of electron nel to the number density of ground level ng ranges from 0.1 to 4 in the main body and exceeds 10 at the edges, as shown in Fig. 19.
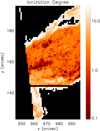 |
Fig. 19. Ionization degree in the prominence higher than 10 000 km above the limb derived from IRIS spectral observations between 15:10 and 15:27 UT. |
5. Hydrogen mass flows
Based on the 2D hydrogen density maps in the prominence body (as shown in Fig. 17), we computed the hydrogen mass distribution by multiplying the density by the hydrogen atom mass, the pixel area, and the thickness, which is assumed to be 1000 km. We have also carried out modeling with thickness varying between 200 and 5000 km. The curves in Fig. 7b in Vial et al. (2019) lead to a unique relation linking Mg II k integrated intensity on one hand and hydrogen or electron EM on the other hand. So the mass flow with a thickness of 200 or 5000 km would be about half or double that of the mass flow with a thickness of 1000 km. The total hydrogen mass in the observed region of the prominence is then derived by summing up all the pixels of the prominence in each raster. We do not take into account the angle between the prominence and the POS in this computation, because this angle varies around 90° with the whole structures considered. Figure 20 shows how the total hydrogen mass in the observed region of the prominence changes with time. In the IRIS observation duration between 11:24 and 16:01 UT, the total mass varies in the range of 6.3 × 10¹³–1.6 × 10¹⁴ g. It reaches a maximum around 12:43 UT, then decreases to a minimum around 15:54 UT. As only about half of the prominence is located in the FOV of the IRIS spectral rasters, the total hydrogen mass of the prominence is estimated by multiplying by two, which leads to the range of 1.3 × 10¹⁴–3.2 × 10¹⁴ g. This is similar to the value derived by Gilbert et al. (2005) and Schwartz et al. (2015). We also calculated the mean temperature of the prominence averaged in the same region, and the variation is shown in Fig. 21. It ranges from 1.10 × 10⁴ to 1.16 × 10⁴ K in the three and a half hours, which is higher than in quiescent prominences. An increase of about 400 K of the mean temperature occurs around 13:30 UT, which is close to the beginning of the activation. Based on the derived POS velocities, the plasmas in the FOV generally move downward with a mean velocity that varies with time between about 1 km s−1 to about 4 km s−1, which indicates the domination of downflows in the prominence. We estimated the mass exchanges between the prominence and the Sun by computing the mass that crosses a layer, which is set to be 10 000 km above the limb with the distribution of mass and velocity in the prominence. The derived total mass drainage from the prominence to the solar surface adds up to 1.3 × 10¹³ g during the whole observation time of IRIS. The value is about one order of magnitude smaller than the total mass of the prominence but is not negligible for the balance of the prominence.
 |
Fig. 20. Total hydrogen mass of the prominence in the FOV of IRIS spectral observation as a function of time, between 11:24 and 16:01 UT. |
 |
Fig. 21. Mean temperature of the prominence in the FOV of IRIS spectral observation as a function of time, between 11:24 and 16:01 UT. |
6. Discussion and conclusions
On May 28, 2014 an erupting prominence occurred near the north-west limb of the Sun. We analyzed a fairly complete set of observations of the eruptive prominence, which included observations by IRIS, SDO, STEREO, SOHO, and K-COR.
We computed the velocity pattern of the prominence. In the POS, downward motions dominate in the lower part of the prominence with a mean velocity less than 5 km s−1 during the activation. In all the 16 IRIS rasters, Doppler redshifts dominate in the lower part of the prominence and no evidence of helical motions is found, which may be caused by the limited duration of the IRIS observation. It only covers the activation phase, while the untwisting motion is not evident before the eruption.
We performed plasma diagnostics by comparing Mg II h&k integrated intensities from IRIS observations and from the NLTE radiative-transfer code PROM7. The derived electron densities range from 1.3 × 10⁹ to 6.0 × 1010 cm−3 and the derived total hydrogen densities range from 1.5 × 10⁹ to 2.4 × 1011 cm−3 in different regions of the prominence. The mean temperature is around 1.1 × 10⁴ K, which is higher than in quiescent prominences.
Since the modeling starts from NLTE computations of hydrogen, once the best Mg II model was found, we were able to compute the neutral hydrogen density and consequently the total hydrogen density. We could build maps of the ionization degree (defined as the ratio of electron to neutral densities). The ionization degree increases at the edges of the structure and is overall in the range 0.1–10. It is interesting to note that for quiescent prominences, the values (around 3) found by Vial (1982) and Hirayama (1985) (1–10) belong to our derived range. However, we also note that our ionization degree reaches rather lower values (down to 0.1), rather surprising for an activated prominence. The fact that we obtain a lower temperature (representative of quiescent prominences) and a lower ionization degree in the central parts of our prominence may mean that the activation starts in peripheral regions more prone to heating, whatever the actual process.
We were also able to derive the total hydrogen mass, which is in the range of 1.3 × 10¹⁴–3.2 × 10¹⁴ g. The total mass drainage from the prominence to the solar surface during the whole observation time of IRIS is about one order of magnitude smaller than the total mass of the prominence.
We do not detect clear cavities in IRIS SJIs, since we roughly see the prominence “head-on”. No evidence of helical motions is found in the Doppler velocity maps during the activation, although we detect untwisting motions in AIA observations between 18:30 UT and 21 UT. There is no clear current sheet in the density and temperature maps. The radial onset height of the PE is about 100 000 km, while McCauley et al. (2015) derived an average value of 83 000 km in their study of 106 limb events.
The non-LTE modeling of Mg II k&h lines allowed us to shed light on the distributions and evolutions of the plasma parameters of eruptive prominences. In a future study, we plan to make a quantitative analysis of more eruptive prominences observed with a larger FOV and longer observing times. We plan to perform a more precise analysis of the large range of profiles, for example, with a machine learning technique. We will also study the effects of the 3D velocity and density structures on the NLTE diagnostic of the prominence plasma. A prominence-corona transition region will be added to our models and once the geometry of the prominences studied is well characterized, 2D NLTE models will be used.
Movie
Movie of Fig. 2 Access here
A lower value was found from SUMER at 1403 Å, in a different case: 8 to 10 erg s−1 sr−1 cm−2 (Cirigliano et al. 2004).
Acknowledgments
The authors acknowledge the CNES and CSC for financial support of this research. IRIS is a NASA small explorer mission developed and operated by LMSAL with mission operations executed at NASA Ames Research Center, and major contributions to downlink communications funded by the Norwegian Space Center (NSC, Norway) through an ESA PRODEX contract. The AIA data are provided courtesy of NASA/SDO and the AIA science team. COSMO/K-COR data are courtesy of the Mauna Loa Solar Observatory, operated by the High Altitude Observatory, as part of the National Center for Atmospheric Research (NCAR). NCAR is supported by the National Science Foundation. We deeply thank Joan Burkepile for processing the K-COR data. We are deeply grateful to Petr Heinzel for his insightful comments and suggestions. SoHO is a project of international cooperation between ESA and NASA.
References
- Aulanier, G., Török, T., Démoulin, P., & DeLuca, E. E. 2010, ApJ, 708, 314 [Google Scholar]
- Bradski, G. 2000, The OpenCV Library, Dr. Dobb’s Journal of Software Tools [Google Scholar]
- Brueckner, G. E., Howard, R. A., Koomen, M. J., et al. 1995, Sol. Phys., 162, 357 [NASA ADS] [CrossRef] [Google Scholar]
- Çelik, G., Ateş, Ş., Özarslan, S., & Taşer, M. 2011, J. Quant. Spectr. Rad. Transf., 112, 2330 [NASA ADS] [CrossRef] [Google Scholar]
- Chatterjee, P., & Fan, Y. 2013, ApJ, 778, L8 [NASA ADS] [CrossRef] [Google Scholar]
- Cirigliano, D., Vial, J. C., & Rovira, M. 2004, Sol. Phys., 223, 95 [NASA ADS] [CrossRef] [Google Scholar]
- De Pontieu, B., Title, A. M., Lemen, J. R., et al. 2014, Sol. Phys., 289, 2733 [NASA ADS] [CrossRef] [Google Scholar]
- Fan, Y. 2012, ApJ, 758, 60 [NASA ADS] [CrossRef] [Google Scholar]
- Fan, Y. 2015, in Solar Prominences, eds. J. C. Vial, & O. Engvold, Astrophys. Space Sci. Lib., 415, 297 [NASA ADS] [CrossRef] [Google Scholar]
- Farnebäck, G. 2003, in Image Analysis, eds. J. Bigun, & T. Gustavsson (Berlin, Heidelberg: Springer, Berlin Heidelberg), 363 [Google Scholar]
- Gibson, S. 2015, in Solar Prominences, eds. J. C. Vial, & O. Engvold, Astrophys. Space Sci. Lib., 415, 323 [NASA ADS] [CrossRef] [Google Scholar]
- Gilbert, H. R., Holzer, T. E., & MacQueen, R. 2005, ApJ, 618, 524 [NASA ADS] [CrossRef] [Google Scholar]
- Giordano, S., Ciaravella, A., Raymond, J. C., Ko, Y.-K., & Suleiman, R. 2013, J. Geophys. Res. (Space Phys.), 118, 967 [NASA ADS] [CrossRef] [Google Scholar]
- Gopalswamy, N. 2015, in Solar Prominences, eds. J. C. Vial, & O. Engvold, Astrophys. Space Sci. Lib., 415, 381 [NASA ADS] [CrossRef] [Google Scholar]
- Heinzel, P., Vial, J.-C., & Anzer, U. 2014, A&A, 564, A132 [NASA ADS] [CrossRef] [EDP Sciences] [Google Scholar]
- Heinzel, P., Susino, R., Jejčič, S., Bemporad, A., & Anzer, U. 2016, A&A, 589, A128 [NASA ADS] [CrossRef] [EDP Sciences] [Google Scholar]
- Hirayama, T. 1985, Sol. Phys., 100, 415 [NASA ADS] [CrossRef] [Google Scholar]
- Hood, A. W., & Priest, E. R. 1981, Geophys. Astrophys. Fluid Dyn., 17, 297 [NASA ADS] [CrossRef] [Google Scholar]
- Howard, R. A., & Vourlidas, A. 2018, Sol. Phys., 293 [CrossRef] [Google Scholar]
- Kohl, J. L., & Parkinson, W. H. 1976, ApJ, 205, 599 [NASA ADS] [CrossRef] [Google Scholar]
- Kumar, P., Karpen, J. T., Antiochos, S. K., et al. 2018, ApJ, 854, 155 [NASA ADS] [CrossRef] [Google Scholar]
- Labrosse, N., & McGlinchey, K. 2012, A&A, 537, A100 [NASA ADS] [CrossRef] [EDP Sciences] [Google Scholar]
- Labrosse, N., Heinzel, P., Vial, J., et al. 2010, Space Sci. Rev., 151, 243 [Google Scholar]
- Leenaarts, J., Pereira, T. M. D., Carlsson, M., Uitenbroek, H., & De Pontieu, B. 2013, ApJ, 772, 90 [NASA ADS] [CrossRef] [Google Scholar]
- Lemen, J. R., Title, A. M., Akin, D. J., et al. 2012, Sol. Phys., 275, 17 [Google Scholar]
- Liu, W., Berger, T. E., & Low, B. C. 2012, ApJ, 745, L21 [NASA ADS] [CrossRef] [Google Scholar]
- Liu, W., De Pontieu, B., Vial, J.-C., et al. 2015, ApJ, 803, 85 [NASA ADS] [CrossRef] [Google Scholar]
- Mathioudakis, M., McKenny, J., Keenan, F., Williams, D., & Phillips, K. 1999, A&A, 351, L23 [Google Scholar]
- McCauley, P. I., Su, Y. N., Schanche, N., et al. 2015, Sol. Phys., 290, 1703 [NASA ADS] [CrossRef] [Google Scholar]
- Mein, P. 1977, Sol. Phys., 54, 45 [NASA ADS] [CrossRef] [Google Scholar]
- Morgan, H., Habbal, S. R., & Lugaz, N. 2009, ApJ, 690, 1119 [NASA ADS] [CrossRef] [Google Scholar]
- Pesnell, W., Thompson, B., & Chamberlin, P. 2012, Sol. Phys., 275, 3 [NASA ADS] [CrossRef] [Google Scholar]
- Robbrecht, E., Berghmans, D., & Van der Linden, R. A. M. 2009, ApJ, 691, 1222 [NASA ADS] [CrossRef] [Google Scholar]
- Schmahl, E., & Hildner, E. 1977, Sol. Phys., 55, 473 [NASA ADS] [CrossRef] [Google Scholar]
- Schmieder, B., Tian, H., Kucera, T., et al. 2014, A&A, 569, A85 [NASA ADS] [CrossRef] [EDP Sciences] [Google Scholar]
- Schwartz, P., Heinzel, P., Kotrč, P., et al. 2015, A&A, 574, A62 [NASA ADS] [CrossRef] [EDP Sciences] [Google Scholar]
- Thompson, W. 2009, Icarus, 200, 351 [NASA ADS] [CrossRef] [Google Scholar]
- Titov, V. S., & Démoulin, P. 1999, A&A, 351, 707 [NASA ADS] [Google Scholar]
- Vial, J. C. 1982, ApJ, 253, 330 [NASA ADS] [CrossRef] [Google Scholar]
- Vial, J. C., & Engvold, O. 2015, in Solar Prominences, Astrophys. Space Sci. Lib. (Springer), 415 [Google Scholar]
- Vial, J. C., Gouttebroze, P., Artzner, G., & Lemaire, P. 1979, Sol. Phys., 61, 39 [NASA ADS] [CrossRef] [Google Scholar]
- Vial, J.-C., Pelouze, G., Heinzel, P., Kleint, L., & Anzer, U. 2016, Sol. Phys., 291, 67 [NASA ADS] [CrossRef] [Google Scholar]
- Vial, J. C., Zhang, P., & Buchlin, E. 2019, A&A, 624, A56 [NASA ADS] [CrossRef] [EDP Sciences] [Google Scholar]
- Webb, D. F. 2015, in Solar Prominences, eds. J. C. Vial, & O. Engvold, Astrophys. Space Sci. Lib., 415, 411 [NASA ADS] [CrossRef] [Google Scholar]
- Wülser, J. P., Lemen, J. R., Tarbell, T. D., et al. 2004, in Proc. SPIE, 5171, 111 [NASA ADS] [CrossRef] [Google Scholar]
- Zirker, J., Engvold, O., & Martin, S. 1998, Nature, 396, 440 [NASA ADS] [CrossRef] [Google Scholar]
All Tables
All Figures
 |
Fig. 1. Panel a: IRIS slit-jaw image in 1400 Å, the dark line in the center corresponds to the position of the slit. Panel b: Mg II k&h spectra observed at the position marked in red on the slit in the SJI image. |
| In the text | |
 |
Fig. 2. Images obtained by SDO/AIA in the He II 304 Å line at different times before (left panel) and during the prominence eruption (middle, right panels). These images are part of a movie available online. |
| In the text | |
 |
Fig. 3. Images obtained by the EUVI instrument on board STEREO A at 16:16:15 UT (panel a) and STEREO B at 16:16:38 UT (panel b) in the He II 304 Å channel. |
| In the text | |
 |
Fig. 4. K-COR images taken at 19:00 UT (panel a) and 20:06 UT (panel b) on May 28 2014, provided courtesy of J. Burkepile. |
| In the text | |
 |
Fig. 5. He II 304 Å image of the filament on May 21, 2014 taken by AIA/SDO. |
| In the text | |
 |
Fig. 6. Prominence observed by AIA in the He II 304 Å channel at 20:06 (left panel), 20:16 (middle panel), and 20:26 UT (right panel). The plus (+) symbols indicate the features tracked at different times and matched to features seen with STEREO A. |
| In the text | |
 |
Fig. 7. Stonyhurst heliographic longitudes and latitudes of the feature tracked at 20:06 (red), 20:16 (blue), and 20:26 UT (green). Indices 1 and 6 correspond respectively to the top and bottom panels of the feature in Fig. 6. |
| In the text | |
 |
Fig. 8. Altitude of the top of the prominence tracked in IRIS (*), SDO/AIA (+), and K-COR (⋄). |
| In the text | |
 |
Fig. 9. POS velocity (right of each panel) derived from AIA image pairs (left: first image of each pair) using the Farnebäck optical flow algorithm at 15:17 (panel a) and 19:34 UT (panel b). The color indicates the value of velocity, the arrows indicate its direction, and the thickness is related to the observed intensity in AIA. |
| In the text | |
 |
Fig. 10. Panel a: spatial distribution of the three groups of profiles in the prominence in different colors derived from IRIS spectral observations between 15:10 and 15:27 UT. Panel b: a set of samples of Mg II k spectra obtained by averaging the profiles of pixels marked with red “×” symbols in the areas with corresponding colors in panel a. |
| In the text | |
 |
Fig. 11. Doppler shifts computed from the extremum-finding of the Mg II k&h line profiles between 15:10 and 15:27 UT. The pixel size in the y direction has been degraded to 1″ to have square pixels. |
| In the text | |
 |
Fig. 12. Composite velocity map derived from IRIS spectral and SJI observations between 15:10 and 15:27 UT. Doppler velocity is shown in the background with the red-blue colorbar. Negative velocities indicate horizontal motions moving towards the observer (blueshifts). Streamlines show the direction of the POS velocity, their color give the value of the POS velocity, and their thickness is related to the observed intensity in IRIS SJI. |
| In the text | |
 |
Fig. 13. Calibrated profiles obtained at the position in red in Fig. 1. Red curve: IRESP calibration method. Green curve: calibration method using the quiet-Sun values of Kohl & Parkinson (1976) as references. |
| In the text | |
 |
Fig. 14. Map of the Mg II k/h intensity ratio in the prominence derived from an IRIS spectral observation between 15:10 and 15:27 UT. |
| In the text | |
 |
Fig. 15. Composite Carrington map of the solar hemisphere centered on 90° Carrington longitude, with the IRIS mosaic of 2014-05-27 (Mg II k radiance, yellow) and, behind the IRIS limb, He II 304 Å data from STEREO A taken at 15:00 UT on May 28 (in red). The regions inside the red, green, and blue circles indicate where the incident radiation comes from as seen from an altitude of 10 000, 20 000, and 50 000 km over the limb respectively, at the position of the prominence (+ symbol). |
| In the text | |
 |
Fig. 16. Electron density in the prominence derived from IRIS spectral observations between 15:10 and 15:27 UT. |
| In the text | |
 |
Fig. 17. Hydrogen density in the prominence derived from IRIS spectral observations between 15:10 and 15:27 UT. |
| In the text | |
 |
Fig. 18. Temperature in the prominence derived from IRIS spectral observations between 15:10 and 15:27 UT. |
| In the text | |
 |
Fig. 19. Ionization degree in the prominence higher than 10 000 km above the limb derived from IRIS spectral observations between 15:10 and 15:27 UT. |
| In the text | |
 |
Fig. 20. Total hydrogen mass of the prominence in the FOV of IRIS spectral observation as a function of time, between 11:24 and 16:01 UT. |
| In the text | |
 |
Fig. 21. Mean temperature of the prominence in the FOV of IRIS spectral observation as a function of time, between 11:24 and 16:01 UT. |
| In the text | |
Current usage metrics show cumulative count of Article Views (full-text article views including HTML views, PDF and ePub downloads, according to the available data) and Abstracts Views on Vision4Press platform.
Data correspond to usage on the plateform after 2015. The current usage metrics is available 48-96 hours after online publication and is updated daily on week days.
Initial download of the metrics may take a while.


