Fig. 10.
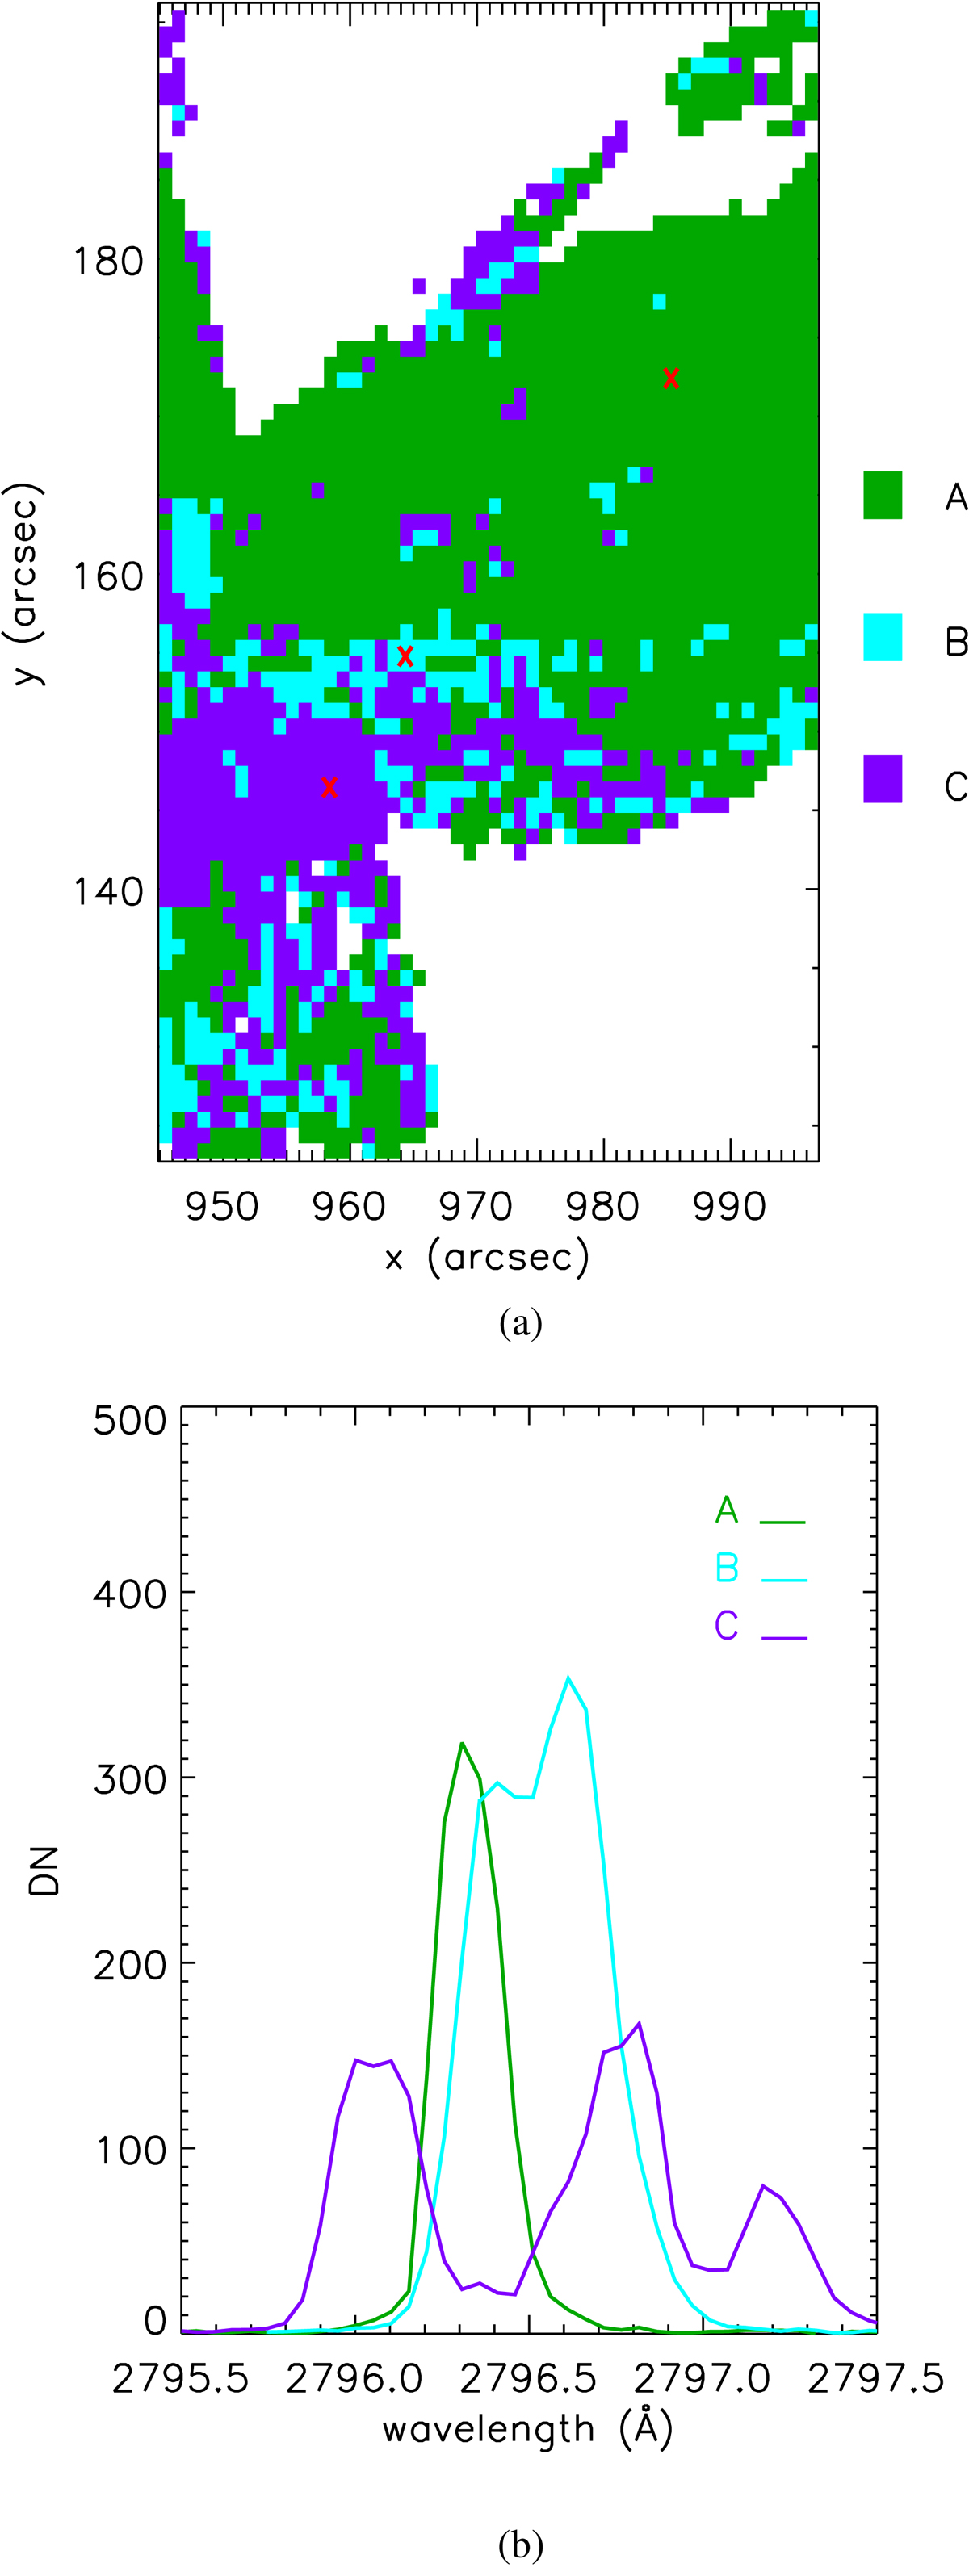
Panel a: spatial distribution of the three groups of profiles in the prominence in different colors derived from IRIS spectral observations between 15:10 and 15:27 UT. Panel b: a set of samples of Mg II k spectra obtained by averaging the profiles of pixels marked with red “×” symbols in the areas with corresponding colors in panel a.
Current usage metrics show cumulative count of Article Views (full-text article views including HTML views, PDF and ePub downloads, according to the available data) and Abstracts Views on Vision4Press platform.
Data correspond to usage on the plateform after 2015. The current usage metrics is available 48-96 hours after online publication and is updated daily on week days.
Initial download of the metrics may take a while.