Fig. A.1.
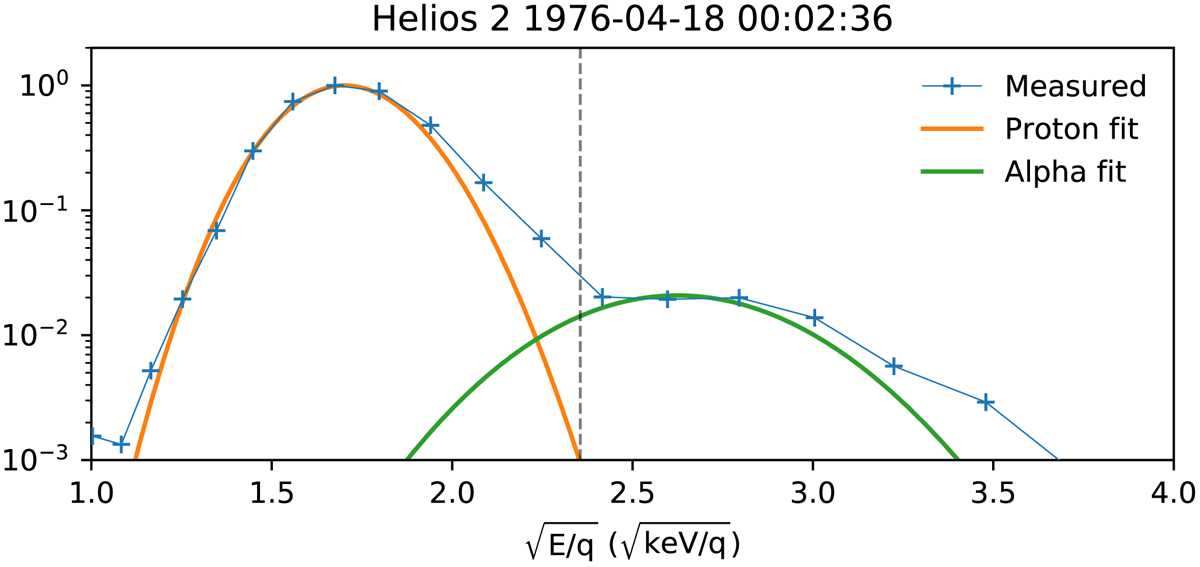
Example solid angle integrated distribution function (blue line with crosses), along with the previously fitted proton distribution function (orange), and fitted alpha particle distribution function (green). The vertical dashed black line shows the threshold above which the distribution function was dominated by alpha particles. The x-axis units are chosen to be linearly proportional to particle velocity for a given particle mass and charge, and the y-axis is normalised to the peak value.
Current usage metrics show cumulative count of Article Views (full-text article views including HTML views, PDF and ePub downloads, according to the available data) and Abstracts Views on Vision4Press platform.
Data correspond to usage on the plateform after 2015. The current usage metrics is available 48-96 hours after online publication and is updated daily on week days.
Initial download of the metrics may take a while.