Fig. 2.
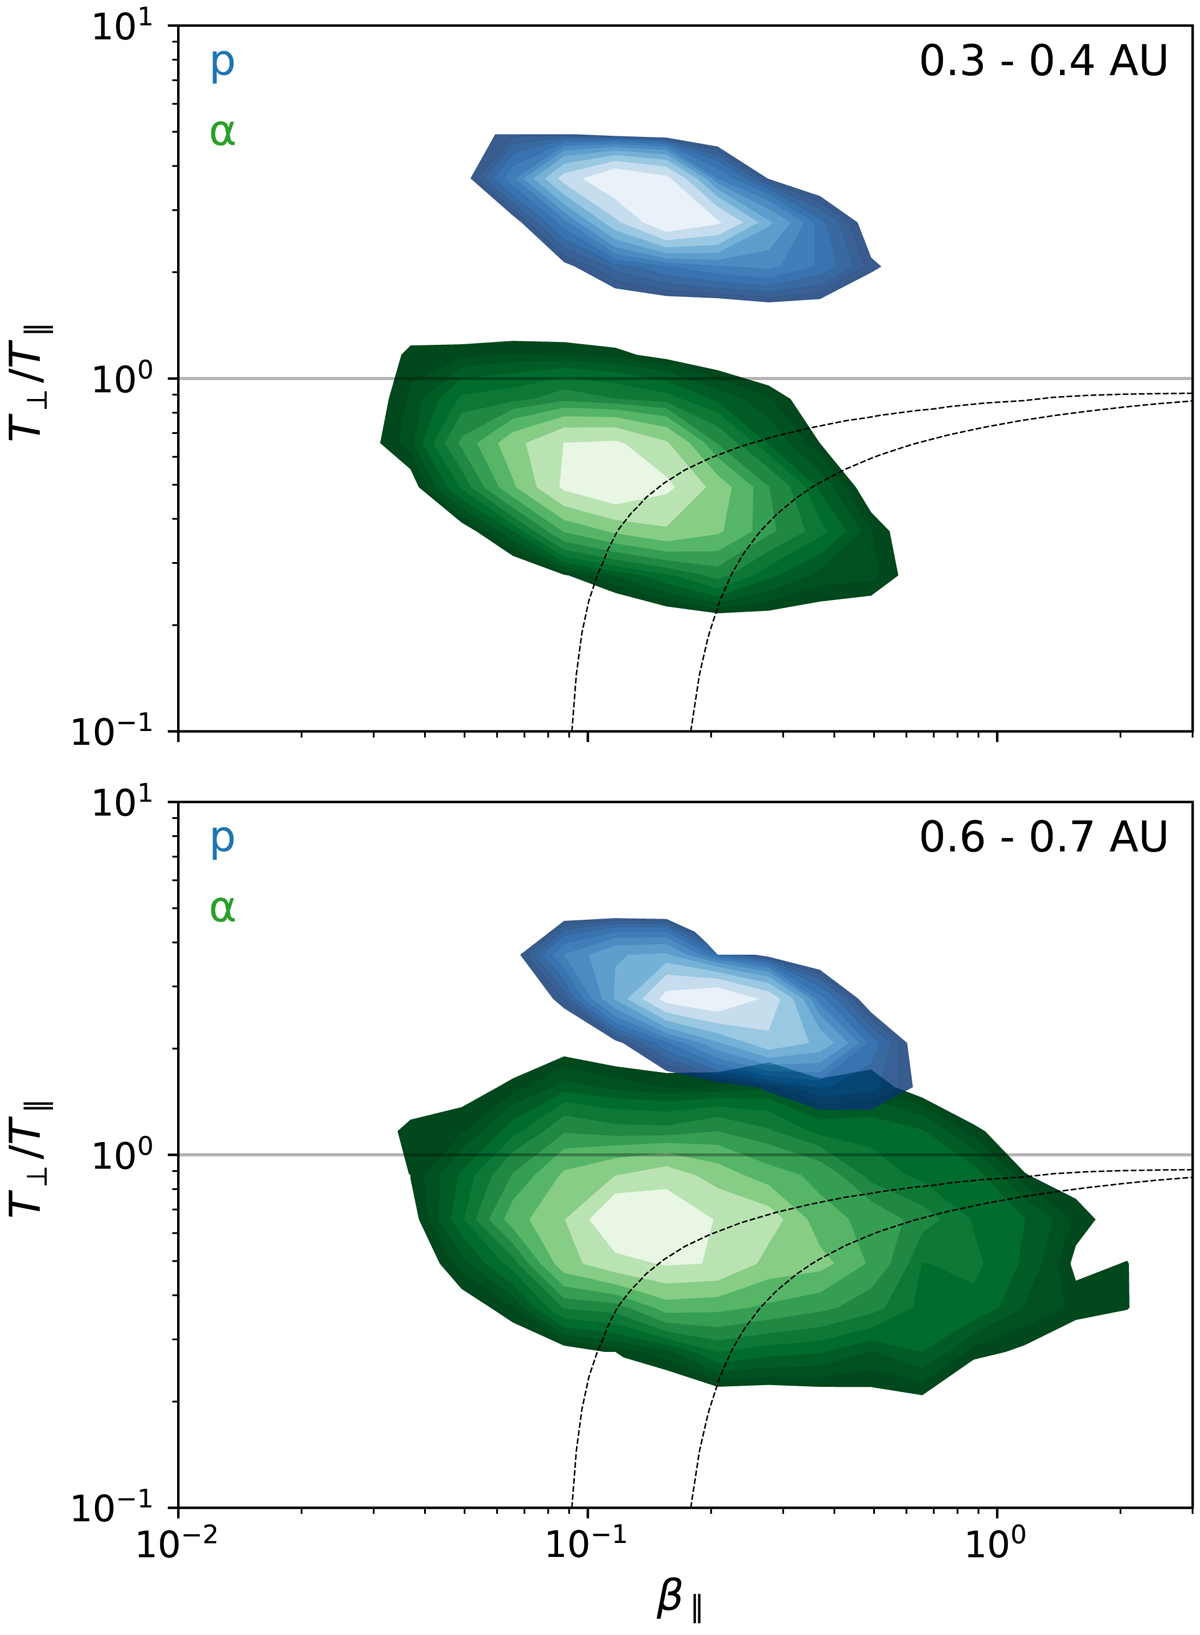
Joint probability distribution of parallel beta and temperature anisotropy for protons (blue) and alphas (green) at radial distances 0.3–0.4 AU (top panel) and 0.6–0.7 AU (bottom panel) in fast solar wind. The contours are logarithmically spaced from the maximum bin count to 0.1 times the maximum bin count. The dashed lines show the alpha firehose instability threshold for normalised growth rates of γ/Ωα = 10−3 (left-hand curve) and 10−2 (right-hand curve). See Appendix B for details of the instability curve calculation. The large spread in alpha particle values is likely partly due to experimental uncertainties in fitting alpha number densities and parallel temperatures.
Current usage metrics show cumulative count of Article Views (full-text article views including HTML views, PDF and ePub downloads, according to the available data) and Abstracts Views on Vision4Press platform.
Data correspond to usage on the plateform after 2015. The current usage metrics is available 48-96 hours after online publication and is updated daily on week days.
Initial download of the metrics may take a while.