Fig. 9.
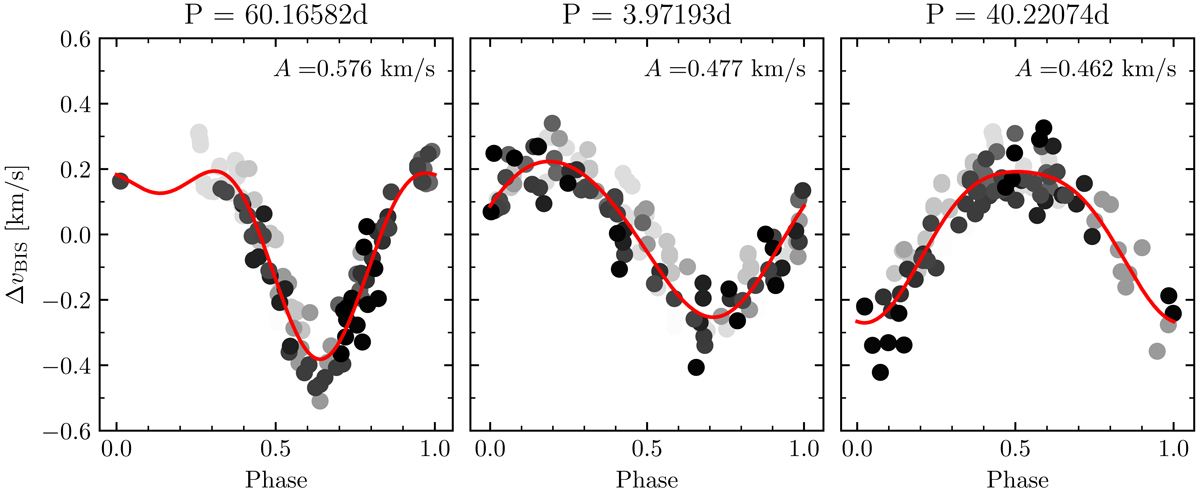
BIS variations of Polaris measured from Hermes spectra phase-folded using three periods determined from Lomb-Scargle periodograms. Each panel shows the BIS variations associated with the periods indicated at the top (ΔvBIS). The signals at P60d = 60.16582 d, Ppuls = 3.97139 d, and P40d = 40.22074 d were identified using a successive pre-whitening procedure in this order. Second-order Fourier series models were fitted to the data using all three periods simultaneously and are shown separately for each signal as a solid red line. P60d and P40d are unlikely to be independent frequencies, since P40d/P60d = 0.6685 is suspiciously close to 2/3 while there remain phase gaps in the sampling of the 60 d signal. The signal at 40.2 d had previously been identified in bisector variations by HC00. We notice that the 40 d and 4 d signals have similar amplitude. The grayscale color coding traces observing date (white to black).
Current usage metrics show cumulative count of Article Views (full-text article views including HTML views, PDF and ePub downloads, according to the available data) and Abstracts Views on Vision4Press platform.
Data correspond to usage on the plateform after 2015. The current usage metrics is available 48-96 hours after online publication and is updated daily on week days.
Initial download of the metrics may take a while.