Fig. 8.
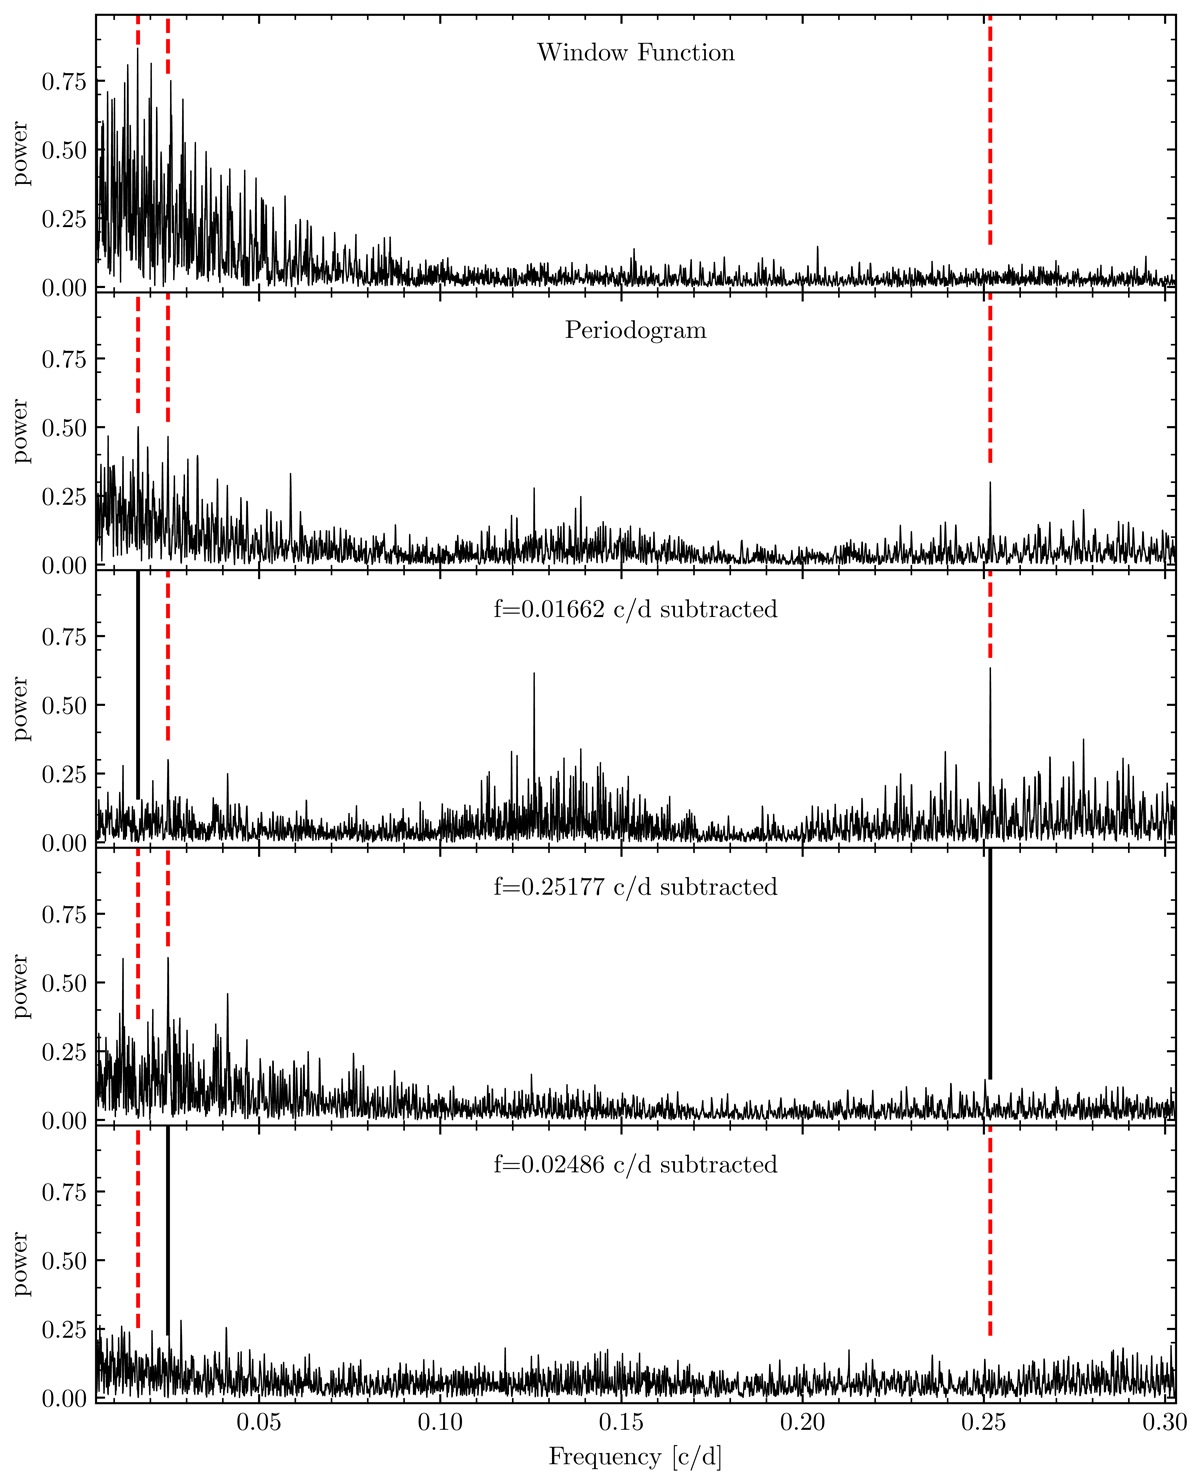
Window function (top panel) and Lomb-Scargle periodograms of the successively pre-whitened Hermes BIS measurements. The three periods shown in Fig. 9 are indicated by vertical dashed red lines. The period subtracted in the previous step is marked by a solid black line in the following periodogram. Other notable peaks in the 2nd and 3rd panel from the top include the peak at twice Ppuls (2nd panel) and at twice P40d (third panel).
Current usage metrics show cumulative count of Article Views (full-text article views including HTML views, PDF and ePub downloads, according to the available data) and Abstracts Views on Vision4Press platform.
Data correspond to usage on the plateform after 2015. The current usage metrics is available 48-96 hours after online publication and is updated daily on week days.
Initial download of the metrics may take a while.