Fig. 7.
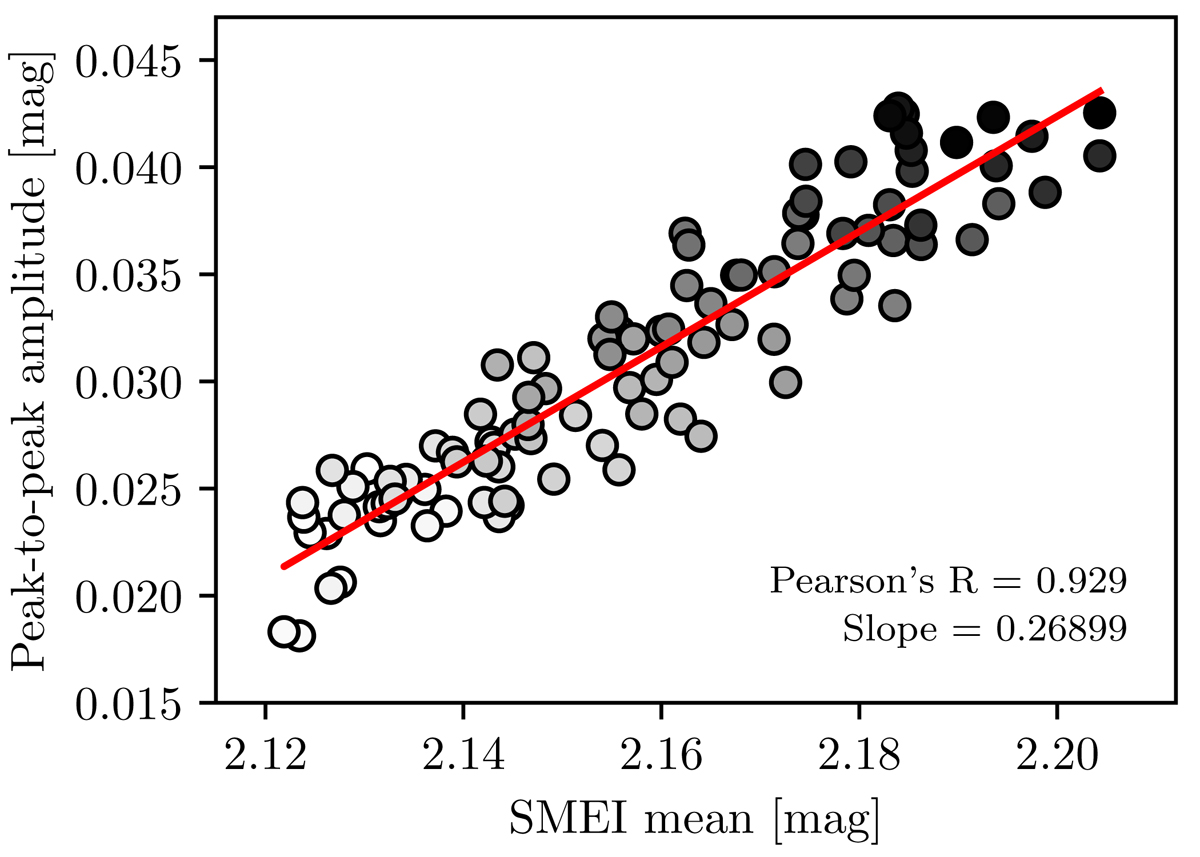
Correlation between Polaris’ growing photometric amplitude and mean magnitude as measured by SMEI. The observations cover a total baseline of 8.65 yr, lasting until 17 days after the first spectroscopic observations were made with Hermes. Observing date is color coded in grayscale to illustrate the increasing amplitude and mean magnitude with time. The red solid line is a least squares fit to the data with the slope and Pearson’s correlation coefficient as indicated.
Current usage metrics show cumulative count of Article Views (full-text article views including HTML views, PDF and ePub downloads, according to the available data) and Abstracts Views on Vision4Press platform.
Data correspond to usage on the plateform after 2015. The current usage metrics is available 48-96 hours after online publication and is updated daily on week days.
Initial download of the metrics may take a while.