Fig. 3.
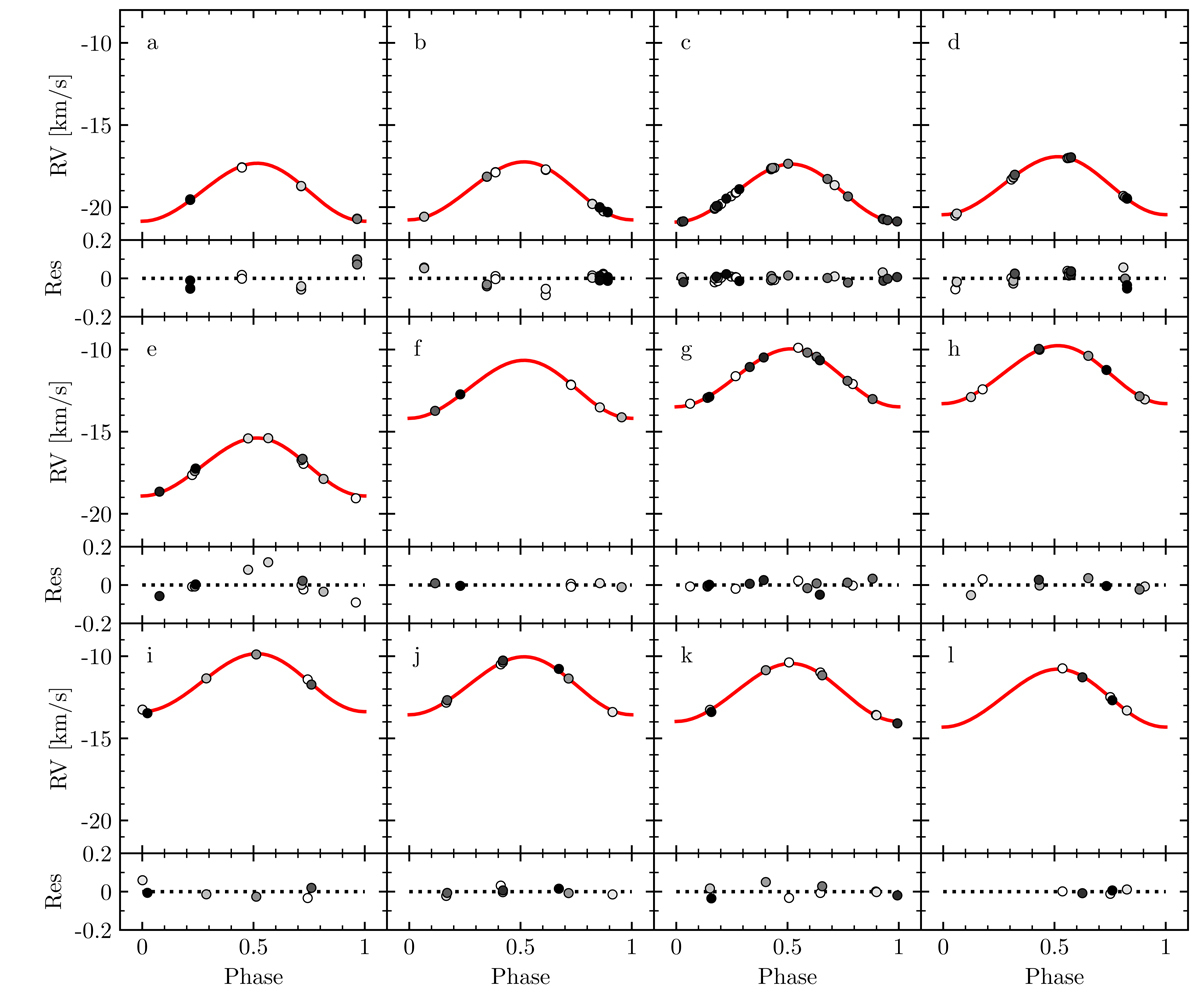
Per-epoch template fits to Hermes RV data. In each panel, a gray scale is applied to distinguish the observing data internal to the given epoch, i.e., the gray scale runs from white to black among the measurements of that epoch. For each epoch, we show the Hermes data phase-folded and zero-phase shifted as determined from the template fit. The red solid curve in each panel is the pulsation model (cf. Fig. 2), shifted to the vγ of that epoch. Fit residuals are shown underneath each template fit, and a grayscale traces observing date in each epoch (white to black).
Current usage metrics show cumulative count of Article Views (full-text article views including HTML views, PDF and ePub downloads, according to the available data) and Abstracts Views on Vision4Press platform.
Data correspond to usage on the plateform after 2015. The current usage metrics is available 48-96 hours after online publication and is updated daily on week days.
Initial download of the metrics may take a while.