Fig. C.1.
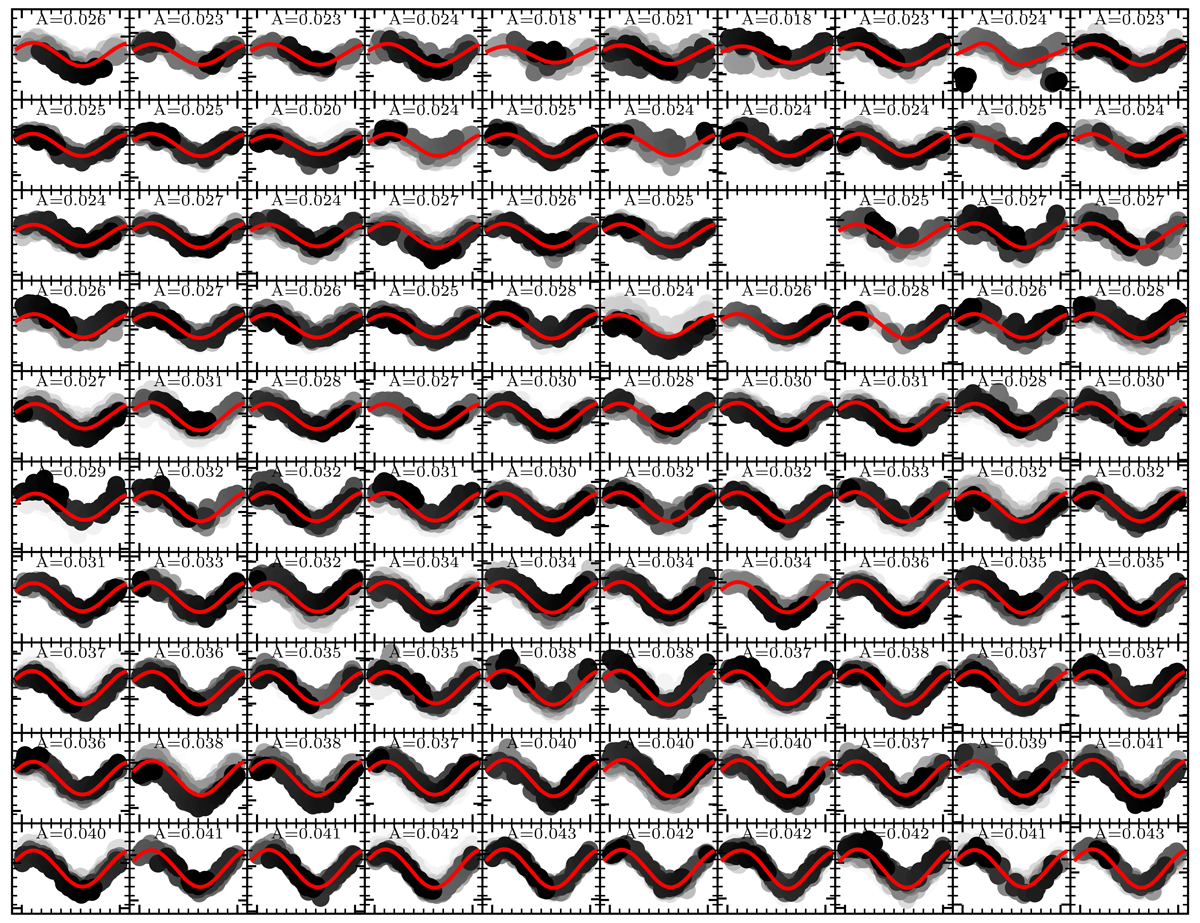
Second-order Fourier series models fitted to 100 sub-epochs of SMEI data, cf. Sect. 4.2. Insufficient data were available for the 27th epoch. Peak-to-peak amplitudes are indicated in each panel. Time increases across the figure from left to right and top to bottom. In each panel, observation dates are grayscaled from white to black. The ordinate (SMEI magnitude) and abscissa (phase) ranges are −0.05 to 0.05 mag and −0.1 to 1.1, respectively, in all panels.
Current usage metrics show cumulative count of Article Views (full-text article views including HTML views, PDF and ePub downloads, according to the available data) and Abstracts Views on Vision4Press platform.
Data correspond to usage on the plateform after 2015. The current usage metrics is available 48-96 hours after online publication and is updated daily on week days.
Initial download of the metrics may take a while.