| Issue |
A&A
Volume 623, March 2019
|
|
|---|---|---|
| Article Number | A55 | |
| Number of page(s) | 6 | |
| Section | Stellar atmospheres | |
| DOI | https://doi.org/10.1051/0004-6361/201834497 | |
| Published online | 06 March 2019 | |
The discovery of a Li/Na-rich giant star in Omega Centauri: formed from the pure ejecta of super-AGB stars?★
1
Dipartimento di Fisica e Astronomia, Università degli Studi di Bologna,
Via Gobetti 93/2,
40129
Bologna,
Italy
e-mail: alessio.mucciarelli2@unibo.it
2
INAF – Osservatorio di Astrofisica e Scienza dello Spazio di Bologna,
Via Gobetti 93/3,
40129
Bologna,
Italy
3
Departamento de Ciencias Fisicas, Universidad Andres Bello,
Fernandez Concha 700,
Las Condes,
Santiago,
Chile
4
GEPI, Observatoire de Paris, Université PSL, CNRS,
Place Jules Janssen,
92195
Meudon,
France
5
Astrophysics Research Institute, Liverpool John Moores University,
146 Brownlow Hill,
Liverpool
L3 5RF,
UK
6
Departamento de Astronomía, Casilla 160-C, Universidad de Concepción,
Concepción,
Chile
Received:
23
October
2018
Accepted:
27
December
2018
We report the discovery of two Li-rich giant stars (fainter than the red giant branch (RGB) bump) in the stellar system Omega Centauri using GIRAFFE-FLAMES spectra. These two stars have A(Li) = 1.65 and 2.40 dex and they belong to the main population of the system ([Fe/H] = –1.70 and –1.82, respectively). The most Li-rich of them (#25664) has [Na/Fe] = +0.87 dex, which is ~0.5 dex higher than those measured in the most Na-rich stars of Omega Centauri of similar metallicity. The chemical abundances of Li and Na in #25664 can be qualitatively explained by deep extra mixing efficient within the star during its RGB evolution or by super-asymptotic giant branch (AGB) stars with masses between ~7 and 8 M⊙. In the latter scenario, this Li/Na-rich star could be formed from the pure ejecta of super-AGB stars before the dilution with pristine material occurs, or, alternatively, be part of a binary system having experienced mass transfer from the companion when this latter evolved through the super-AGB phase. In both these cases, the chemical composition of this unique object could allow to look for the first time at the chemical composition of the gas processed in the interior of super-AGB stars.
Key words: stars: abundances / techniques: spectroscopic / globular clusters: individual: Omega Centauri
© ESO 2019
1. Introduction
The lithium abundance – A(Li)1 – in globular clusters (GCs) remains an unsolved and fascinating riddle. These stellar systems are known to have multiple populations (MPs) characterised by significant star-to-star variations in the abundances of elements involved in proton-capture reactions, that is, He, C, N, O, Na, Mg, and Al, often structured in coherent patterns. Among these patterns, the most evident is the Na–O anticorrelation, observed in all the old GCs (Carretta et al. 2009; Mucciarelli et al. 2009), with the only exceptions so far being Ruprechet 106 (Villanova et al. 2013) and E3 (Monaco et al. 2018). According to their Na and O abundances, GC stars are roughly classified in first (1P) and second (2P) populations, indicating stars without or with chemical signatures from proton-capture reactions, respectively. These reactions occur at temperatures exceeding 107 K, in stellar layers having no Li because it is expected to be totally destroyed at temperatures of a few times 106 K. For this reason, 2P stars should be Li-free or exhibit a significant depletion of A(Li) with respect to 1P stars. Surprisingly, no relevant difference in A(Li) is found in 1P and 2P stars, with some GCs showing only hints of a Li–Na anticorrelation or a larger scatter in A(Li) in 2P stars with respect to 1P stars (Pasquini et al. 2005; Lind et al. 2009; González Hernández et al. 2009; Monaco et al. 2012; Dobrovolskas et al. 2014) and other GCs with a remarkably similar Li content among the stars (Bonifacio 2002; D’Orazi et al. 2014, 2015a). Theoretical models proposed to explain the formation of MPs suggest different polluters in order to produce the observed Na–O anticorrelation, the most popular ones being fast-rotating massive (Decressin et al. 2007) and asymptotic giant branch (AGB) stars (D’Ercole et al. 2008). The former are not able to produce fresh Li, while the latter (especially the most massive ones, the so-called super-AGB stars) can produce new Li through the Cameron-Fowler mechanism (Cameron & Fowler 1971).
In this framework, the stellar system Omega Centauri (NGC 5139) is a special case, showing a large [Fe/H] spread (at variance with GCs that are homogeneous in their Fe content; see e.g. Willman & Strader 2012) but also an extended Na–O anticorrelation (Johnson & Pilachowski 2010; Marino et al. 2011). Also, Omega Centauri exhibits a clear and well-defined Li-Na anticorrelation (Mucciarelli et al. 2018, hereafter M2018). In this paper we report the discovery of two giant stars in Omega Centauri showing a significant enhancement of A(Li) with respect to other stars of the system. One of these stars is also significantly enriched in Na.
2. Observations and data analysis
In M2018 we presented Li, Na, and Fe abundances of 199 lower red giant branch (LRGB, RGB stars fainter than the RGB bump magnitude level and having already completed the first dredge-up) stars, observed with the multi-objecthigh-resolution spectrograph FLAMES–GIRAFFE (Pasquini et al. 2000) mounted at the ESO Very Large Telescope under the program 096.D-0728 (PI: Mucciarelli). We secured one exposure with the setup HR12 (Δλ = 5821–6146 Å, R ~ 20 000), two with HR13 (Δλ = 6120–6405 Å, R ~ 26 000) and three with HR15N (Δλ = 6470–6790 Å, R ~ 19 000). The selected GIRAFFE gratings allow to measure the resonance Li line at 6708 Å, the Na D doublet at 5890–5896 Å and some tens of Fe I lines. In this sample, we identified two additional LRGB stars (namely #25664 and #126107 from the Bellini et al. 2009 catalogue) with a strong enhancement of A(Li).
Here we briefly summarise the approach used for the chemical analysis, referring the reader to M2018 for a detailed description. Effective temperatures (Teff) and surface gravities (log g) were derived from photometry. We adopted the Alonso et al. (1999) colour-Teff transformations, using the (B-V)0, (V-I)0 and (V-K_s)0 broad-band colours from the optical photometry by Bellini et al. (2009) and the 2MASS near-infrared database (Skrutskie et al. 2006). The employed colour excess and distance modulus are E(B − V) = 0.12 mag (Harris 1996) and  = 13.70 mag (Bellazzini et al. 2004). Microturbulent velocities were derived by minimising the trend between the line strength and the abundances of the Fe I lines.
Abundances of Fe were derived from the measured equivalent widths using the GALA code (Mucciarelli et al. 2013), while the equivalent widths were measured with the DAOSPEC code (Stetson & Pancino 2008) managed through the wrapper 4DAO (Mucciarelli 2013). The abundances of Li and Na were obtained through a χ2 -minimisation between the observed and synthetic spectra (the latter calculated with the SYNTHE code, Kurucz 2005). These abundances have been corrected for non-local thermodynamical equilibrium (NLTE) using the corrections by Lind et al. (2008, 2011) for Li and Na, respectively. Information about the two stars is listed in Table 1.
Main information about the two Li-rich stars in Omega Centauri.
3. Results
Both stars are members of Omega Centauri, as confirmed by their radial velocities (see Table 1) and proper motions (Bellini et al. 2009; Gaia Collaboration 2018). According to their iron content ([Fe/H] = –1.82 and –1.70 dex for #25664 and #126107, respectively), the two stars belong to the main (metal-poor) population of the system (see Fig. 1 in M2018).
The two stars exhibit A(Li) larger than those measured in the other LRGB stars of Omega Centauri. The A(Li) distribution of the LRGB stars in this system is peaked at A(Li) ~ 0.9–1 dex with a significant (~30%) fraction of stars with low Li abundances (down to ~0.4–0.5 dex). The fit of the resonance Li line at 6708 Å provides abundances of  = 2.4 dex for #25664 and
  = 1.65 dex for #126107. The upper panels of Fig. 1 show the Li line at 6708 Å for the two stars in comparison with the (weaker) Li lines observed in two Omega Centauri stars with similar atmospheric parameters and metallicity (namely #186775 and #280264), and belonging to the main component of the A(Li) distribution (A(Li) ~ 0.9–1 dex).
Concerning Na, we derived [Na/Fe]NLTE = +0.87 and +0.14 for #25664 and #126107, respectively. The lower panel of Fig. 1 compares the strength of the Na I D lines in #25664 and in the comparison star #186775 (that is one of the most Na-rich stars among the metal-poor ones of Omega Centauri). As a sanity check we also used the weak Na I doublet at 6154–6160 Å, available in the HR13 setup. This doublet provides [Na/Fe]NLTE = +1.07 and +0.08 for #25664 and #126107, respectively, confirming the extreme Na enhancement obtained from the Na D lines for the first star. In Fig. 2 we compare the spectra of #25664 and of the comparison star #186775 (the same shown in Fig. 1) around the Na I doublet at 6154–6160 Å. These Na I lines are located on the linear part of the curve of growth and they are less sensitive to velocity fields and saturation effects with respect to the Na I D lines. Because the two sets of lines provide compatible results, in the following we will refer to abundances derived from Na I D lines to compare the abundances of the two Li-rich stars with those of the other stars of Omega Centauri discussed in M2018 (in fact, for most of the stars analysed in M2018 the Na I lines at 6154–6160 Å are too weak and provide upper limits only).
Figure 3 shows the behaviour of [Na/Fe]NLTE as a function of [Fe/H] for the LRGB stars of Omega Centauri (grey circles, M2018) with the two Li-rich stars marked as red and blue triangles. The metal-poor stars of Omega Centauri span a large range (~1 dex) in Na abundance, similar to the [Na/Fe] range measured in the old GCs studied so far (see e.g. Carretta et al. 2009). While #126107 has a [Na/Fe]NLTE compatible with the Na distribution of stars with similar [Fe/H] (and can be considered as a 2P star), #25664 exhibits an extraordinary enhancement of Na, ~0.5 dex larger than that measured in the most Na-rich Omega Centauri stars with similar [Fe/H] (see Fig. 3). Very few GC stars with [Na/Fe] significantly larger than the most Na-rich stars in the parent cluster have been discovered so far, namely in Omega Centauri (Marino et al. 2011), NGC 2808 (Carretta et al. 2006), and M62 (Lapenna et al. 2015). All these stars are brighter than the RGB bump level but no measurement of Li is available.
Figure 4 shows the position of the two Li-rich stars in the [Na/Fe]NLTE- plane. The LRGB stars of the system define a clear Li–Na anticorrelation, while the two target stars lie outside the mean locus defined by the other stars.
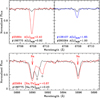 |
Fig. 1 Resonance Li line in #25664 (left upper panel, red line) and #126107 (right upper panel, blue line) both compared with stars of Omega Centauri of similar metallicity and atmospheric parameters (M2018). Lower panel: comparison between the Na I D lines in #25664 and in the comparison star. Plus symbols indicate the interstellar Na D2 lines. |
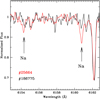 |
Fig. 2 Na I doublet at 6154-6160 Å in #25664 (red line) compared with the spectrum of the star #186775 (black line). |
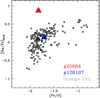 |
Fig. 3 Behaviour of [Na/Fe]NLTE as a function of [Fe/H] for the LRGB stars of Omega Centauri (grey circles, M2018). The red and blue triangles indicate the position of #25664 and #126107, respectively. |
4. Discussion
We have discovered the first two Li-rich stars in Omega Centauri, one of them (#25664) with an unexpected and exceptional enhancement of Na, while the other (#126107) with a Na abundance compatible with the [Na/Fe] distribution of the stars of Omega Centauri with similar metallicity. Li-rich stars are rare in GCs; only 13 are known so far (Carney et al. 1998; Kraft et al. 1999; Smith et al. 1999; Ruchti et al. 2011; Koch et al. 2011; Monaco et al. 2012; D’Orazi et al. 2015b; Kirby et al. 2016), 10 of them belonging tothe RGB. Figure 5 summarises the most up to date information about Li-rich GC stars, showing A(Li) as a function of log g (as a proxy of the evolutionary stage) for the LRGB stars of Omega Centauri (grey circles), the two Li-rich stars (red and blue triangles) and the Li-rich stars discovered so far in GCs (green circles). As a reference for the predicted evolution of A(Li), we show also A(Li) for the starsin the GC NGC 6397 (black points, Lind et al. 2009). Among the Li-rich stars in GCs, Na abundances have only been measured for five of them (squared green circles in Fig. 5); all of them have [Na/Fe] compatible with the Na distribution of the parent cluster, at variance with #25664.
Taking into account the effect of the Li depletion due to the first dredge-up (according to the prescriptions by Mucciarelli et al. 2012), the two Li-rich giants should have an initial A(Li) of about 3.8 and 3.1 dex, for #25664 and #126107, respectively. These values are significantly above the typical value measured in unevolved Population II stars belonging to the Spite Plateau (A(Li) ~ 2.2–2.4 dex) but also higher than the value predicted by the Big Bang nucleosynthesis model coupled with the baryon density provided by the WMAP and Planck satellites (A(Li) ~ 2.7 dex). In the case of #25664, its initial A(Li) value is comparable with the Li abundance measured in the Li-rich dwarf star discovered in NGC 6397 by Koch et al. (2011), A(Li) = 4.2 dex, but thelatter has a Na content compatible with the [Na/Fe] abundance of 1P stars of NGC 6397 (Pasquini et al. 2014). Interestingly, similar lithium enhancements have recently been detected in metal-poor giant field stars by Li et al. (2018). Also in these cases, abundances of elements other than lithium are similar to the trend observed for similar stars.
The origin of Li-rich stars remains a matter of debate and can be ascribed to different processes, including external or internal Li production. One of the most invoked external mechanisms to increase A(Li) is the engulfment of small bodies, like planets or brown dwarfs (Siess & Livio 1999) that should enhance both Li and Be. This scenario seems to be unlikely for the Li-rich stars in Omega Centauri because of the low occurrence of metal-poor stars hosting planets (see e.g. Johnson et al. 2010); usually the planet engulfment is considered the main mechanism to explain Li-rich giants with metallicity higher than approximately −0.5 dex (Casey et al. 2016). Also, the engulfment of a planet should also increase the rotational velocity (Siess & Livio 1999) and the chromospheric activity of the star (Fekel & Balachandran 1993). We checked that the measured full widths at half maximum are compatible with the nominal spectra resolutions and we estimate that in these stars the projected rotational velocity is virtually compatible with no stellar rotation. On the other hand, the Na D lines do not show evidence of circumstellar material.
Anotherproposed mechanism to explain Li-rich stars but invoking internal production of fresh Li is the Cameron-Fowler mechanism (Cameron & Fowler 1971). In this case we can envisage two possibilities. The first option is extra mixing, efficient within the star during its RGB evolution. This mixing needs to circulate matter between the base of the convective envelope and a region close to the H-burning shell. Both speed and depth of the circulation must be such that 3He from the convective envelope is transported to regions with temperatures high enough to activate the  reaction, with7 Be quickly transported back to cooler regions where Li can then be produced by the
 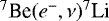 reaction. Several papers (see, e.g. Da Silva et al. 1995; Sackmann & Boothroyd 1999; Charbonnel & Balachandran 2000; Denissenkov & VandenBerg 2003; Denissenkov & Herwig 2004; Guandalini et al. 2009; Palmerini et al. 2011, and references therein) have discussed scenarios/mechanisms capable of achieving this in detail. Denissenkov & VandenBerg (2003), in particular, have shown that by calibrating the extra mixing parameters, enhanced Li abundances in the envelope can be produced, together with increased Na (and depleted O). This could for example go towards explaining the exceptionally high [Na/Fe] measured in #25664.
The extra mixing is usually (but not only) associated with rotation, and the common assumption is that it is activated after the RGB bump, because the molecular weight barrier between the base of the convective envelope and the H-burning shell, existing before this event, is expected to inhibit element transport between envelope and shell. Indeed, Chanamé et al. (2005) have shown with full stellar evolution calculations including rotation and rotational mixings, that this μ barrier prevents rotational mixing from being efficient between the convective envelope and the H-burning shell (see also Sweigart & Mengel 1979). Our two Li-rich objects are located below the RGB bump, as shown in Figs. A.1 and A.2.
The second option is production of fresh Li this time in AGB stars (see e.g. Ventura & D’Antona 2010; D’Antona et al. 2012), and mass transfer from a massive star that evolved through the AGB phase and transferred Li-rich material onto our targets.
From a theoretical point of view, the super-AGB stars, with masses of 7–8 M⊙, may be able to produce a large amount of Li and Na simultaneously (Ventura & D’Antona 2011; D’Antona et al. 2012; Doherty et al. 2014). In these stars, Li is produced through the Cameron-Fowler mechanism, while Na is produced through the Ne–Na cycle. We remind the reader that super-AGB stars could play a relevant role in the explanation of the MPs observed in all GCs and in Omega Centauri, because they are among the candidate polluter stars able to generate the 2P stars.
In this framework, two possible scenarios can be envisaged for #25664:
(1) The star formed directly from the gas ejected from super-AGB stars before dilution with pristine gas. Theoretical models of MPs based on AGB stars as main polluters need to include some dilution of the AGB ejecta with pristine gas in order to reproduce the observed chemical patterns. This is due to the mass dependence of the AGB yields that should lead to a Na–O correlation, at variance with what has been observed, if no dilution process is accounted for. However, it has been proposed that a small fraction of stars were formed from the pure ejecta of super-AGB stars before the dilution process, preserving the original chemical composition of these polluting stars (D’Antona et al. 2012). This mechanism could explain the presence of a He-rich (Y ~ 0.35) sub-population in some systems (like Omega Centauri and NGC 2808, Norris 2004; Piotto et al. 2005; Sollima et al. 2005), because the super-AGB stars should also produce a large amount of He. Hence, in this scenario we expect that #25664 should have a high He content (Y > 0.3).
(2) The star was a member of a binary system together with a massive star and accreted Li-rich material from the companion when the latter reached the super-AGB phase. In this case, the abundances that we measure are not its original ones but they reflect the chemical composition of the interior of the companion, plus some degree of dilution with the convective envelope of the accreting star. The radial velocities measured from individual FLAMES spectra do not show evidence of variability. However, they were taken over a period of about 3 weeks and we cannot exclude that the star is a member of a binary system of a longer period. Hence, with the current dataset we are not able to disentangle between the two scenarios.
Even if the precise amount of Li and Na produced by AGB stars of different masses is highly sensitive to several physical assumptions(i.e. the treatment of the convection, overshooting, and mass loss), the measured Li and Na abundances of #25664 are qualitatively compatible with those foreseen for the super-AGB stars (D’Antona et al. 2012; Doherty et al. 2014).
This Li/Na-rich star may represent direct evidence of extra mixing occurring before the RGB Bump, or the first observed relic of the gas ejected from super-AGB stars, demonstrating that these stars can play a role in explaining the MPs in Omega Centauri. In both cases, a future inventory of the chemistry of this star, in particular the elements involved in the proton-capture reactions (i.e. He, CNO, Mg, Al and their isotopic ratios), is crucial to understanding the origin of this unique object. For instance, measurement of the 12C/13C isotopic ratio will confirm or refute the pre-bump nature of this star. If this were to be confirmed, the Denissenkov & VandenBerg (2003) model could perhaps be discarded leaving the AGB scenario only. If the chemical composition of #25776 were confirmed, the scenario related to super-AGB stars, this star would allow for the chemical composition of the gas processed in the interior of the super-AGB stars to be studied directly.
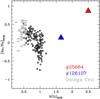 |
Fig. 4 Behaviour of [Na/Fe]NLTE as a function of |

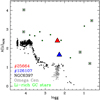 |
Fig. 5 Behaviour of A(Li) as a function of log g for the stars in Omega Centauri (grey circles, M2018), in the two Li-rich stars discussed here (red and blue triangles), in the Li-rich stars discovered so far in GCs (green circles, squared symbols are the stars for which [Na/Fe] has been measured), and the GC NGC 6397 (black circles, Lind et al. 2009). |
Acknowledgements
We thank the anonymous referee for his/her useful comments and suggestions. L.M. acknowledges support from “Proyecto interno” of the Universidad Andres Bello. P.B. acknowledges financial support from the Scientific Council of Observatoire de Paris and from the action fédératrice “Exploitation Gaia”. S.V. gratefully acknowledges the support provided by Fondecytreg. n. 1170518.
Appendix A: Effective temperatures
Teff is the most crucial parameter in the determination of A(Li), while the other atmospheric parameters have a negligible impact on A(Li). Figures A.1 and A.2 show the position of the two Li-rich stars in the colour–magnitude diagrams obtained with the WFI catalogue of Bellini et al. (2009) and the Gaia Data Release 2 (Gaia Collaboration 2018). In both diagrams the two stars are located along the RGB and below the RGB Bump.
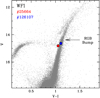 |
Fig. A.1 (V, V –I) colour–magnitude diagram of Omega Centauri obtained from the WFI catalogue by Bellini et al. (2009) with the position of the two Li-rich stars marked (red circle for #25664 and blue circle #126107). The arrow indicates the luminosity level of the RGB Bump of the metal-poor, dominant population of Omega Centauri. |
As a sanity check for the reliability of the photometric Teff we checked alsothe excitation equilibrium for the two target stars. Right panels in Fig. A.3 show the behaviour of the abundance of neutral iron lines as a function of the excitation potential χ (red circles for #25664 and blue circles for #126107). The photometric Teff satisfy the excitation equilibrium well, confirming the reliability of the adopted atmospheric parameters. Also, we show in the left panels of Fig. A.3 the strength of one Fe I line in the two Li-rich stars in comparison with the same stars already shown in Fig. 1. The very similar line strength confirms the similar metallicity and atmospheric parameters of the two pairs of stars.
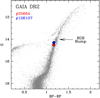 |
Fig. A.2 (G, BP–RP) colour–magnitude diagram of Omega Centauri obtained with Gaia Data Release 2 (Gaia Collaboration 2018) with the position of the two Li-rich stars marked (same colours and symbols of Fig. A.1). |
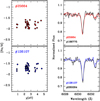 |
Fig. A.3 Left panels: behaviour of the abundance of Fe I lines as function of the excitation potential χ for the Li-rich stars, red circles for #25664 (upper left panel) and blue circles for #126107 (lower left panel). Right panels: spectral region around a Fe I line in #25664 (upper right panel, red line) and #126107 (lower right panel, blue line), both compared with stars in Omega Centauri with similar metallicity and atmospheric parameters as shown in Fig. 1. |
Appendix B: Planet engulfment
We estimated the amount of rocky material that should be ingested by the two stars in order to reproduce the measured A(Li), following the same procedure adopted by Mott et al. (2017). Assuming that two stars have a total mass of 0.8 M⊙ each, and a mass of the convective envelope of about 0.45 M⊙, the measured A(Li) correspond to a total lithium mass of 1.2 × 10²¹ kg and 2.1 × 10²⁰ kg, for #25664 and #126107, respectively. Considering the fractional lithium abundance of rocky material provided by McDonough (2001), the measured A(Li) could be explained by the engulfment of ~123 and ~22 Earth masses, for #25664 and #126107, respectively. For the latter star, we cannot totally rule out that the measured A(Li) can be explained by the engulfment of small bodies. On the other hand, for #25664 the engulfment of the expected amount of rocky material (~123 Earth masses) seems to be unlikely.
References
- Alonso, A., Arribas, S., & Martinez-Roger, C. 1999, A&A, 140, 261 [Google Scholar]
- Bellazzini, M., Ferraro, F. R., Sollima, A., Pancino, E., & Origlia, L. 2004, A&A, 424, 199 [NASA ADS] [CrossRef] [EDP Sciences] [Google Scholar]
- Bellini, A., Piotto, G., Bedin, L. R., et al. 2009, A&A, 493, 958 [Google Scholar]
- Bonifacio, P. 2002, A&A, 390, 91 [NASA ADS] [CrossRef] [EDP Sciences] [Google Scholar]
- Cameron, A. G. W., & Fowler, W. A. 1971, ApJ, 164, 111 [Google Scholar]
- Carlberg, J. K., Majewski, S. R., & Arras, P. 2009, ApJ, 700, 832 [Google Scholar]
- Carney, B. W., Fry, A. M., & Gonzalez, G. 1998, AJ, 116, 2984 [NASA ADS] [CrossRef] [Google Scholar]
- Carretta, E., Bragaglia, A., Gratton, R., et al. 2006, A&A, 450, 523 [NASA ADS] [CrossRef] [EDP Sciences] [Google Scholar]
- Carretta, E., Bragaglia, A., Gratton, R., et al. 2009, A&A, 505, 117 [NASA ADS] [CrossRef] [EDP Sciences] [Google Scholar]
- Casey, A. R., Ruchti, G. M., Masseron, T., et al. 2016, MNRAS, 461, 3336 [NASA ADS] [CrossRef] [Google Scholar]
- Chanamé, J., Pinsonneault, M., & Terndrup, D. M. 2005, ApJ, 631, 540 [NASA ADS] [CrossRef] [Google Scholar]
- Charbonnel, C., & Balachandran, S. C. 2000, A&A, 359, 563 [Google Scholar]
- D’Antona, F., D’Ercole, A., Carini, R., Vesperini, E., & Ventura, P. 2012, MNRAS, 426, 1710 [NASA ADS] [CrossRef] [Google Scholar]
- da Silva, L., de La Reza, R., & Barbuy, B. 1995, ApJ, 448, 41 [NASA ADS] [CrossRef] [Google Scholar]
- Decressin, T., Charbonnel, C., & Meynet, G. 2007, A&A, 475, 859 [NASA ADS] [CrossRef] [EDP Sciences] [Google Scholar]
- Denissenkov, P. A., & Herwig, F. 2004, ApJ, 612, 1081 [NASA ADS] [CrossRef] [Google Scholar]
- Denissenkov, P. A., & VandenBerg, D. A. 2003, ApJ, 593, 509 [NASA ADS] [CrossRef] [Google Scholar]
- Denissenkov, P. A., & Weiss, A. 2000, A&A, 358, 49 [Google Scholar]
- D’Ercole, A., Vesperini, E., D’Antona, F., McMillan, S. L. W., & Recchi, S. 2008, MNRAS, 391, 825 [NASA ADS] [CrossRef] [Google Scholar]
- Dobrovolskas, V., Kučinskas, A., Bonifacio, P., et al. 2014, A&A, 565, A121 [NASA ADS] [CrossRef] [EDP Sciences] [Google Scholar]
- Doherty, C. L., Gil-Pons, P., Lau, H. H. B., et al. 2014, MNRAS, 441, 582 [NASA ADS] [CrossRef] [Google Scholar]
- D’Orazi, V., Angelou, G. C., Gratton, R. G., et al. 2014, ApJ, 791, 39 [NASA ADS] [CrossRef] [Google Scholar]
- D’Orazi, V., Gratton, R. G., Angelou, G. C., et al. 2015a, MNRAS, 449, 4038 [NASA ADS] [CrossRef] [Google Scholar]
- D’Orazi, V., Gratton, R. G., Angelou, G. C., et al. 2015b, ApJ, 801, L32 [NASA ADS] [CrossRef] [Google Scholar]
- Fekel, F. C., & Balachandran, S. 1993, ApJ, 403, 708 [NASA ADS] [CrossRef] [Google Scholar]
- Gaia Collaboration (Brown, A.G.A., et al.) 2018, A&A, 616, A1 [NASA ADS] [CrossRef] [EDP Sciences] [Google Scholar]
- González Hernández, J. I., Bonifacio, P., Caffau, E., et al. 2009, A&A, 505, L13 [NASA ADS] [CrossRef] [EDP Sciences] [Google Scholar]
- Guandalini, R., Palmerini, S., Busso, M., & Uttenthaler, S. 2009, PASA, 26, 168 [NASA ADS] [Google Scholar]
- Harris, W.E. 1996, AJ, 112, 1487 [NASA ADS] [CrossRef] [Google Scholar]
- Johnson, C. I., & Pilachowski, C. A. 2010, ApJ, 722, 1373 [NASA ADS] [CrossRef] [Google Scholar]
- Johnson, J. A., Aller, K. M., Howard, A. W., & Crepp, J. R. 2010, PASP, 122, 905 [NASA ADS] [CrossRef] [Google Scholar]
- Kirby, E. N., Guhathakurta, P., Zhang, A. J., et al. 2016, ApJ, 819, 135 [NASA ADS] [CrossRef] [Google Scholar]
- Koch, A., Lind, K., & Rich, R. M. 2011, ApJ, 738, L29 [NASA ADS] [CrossRef] [Google Scholar]
- Kraft, R. P., Peterson, R. C., Guhathakurta, P., et al. 1999, ApJ, 518, L53 [NASA ADS] [CrossRef] [Google Scholar]
- Kurucz, R. L. 2005, MSAIS, 8, 14 [NASA ADS] [Google Scholar]
- Lapenna, E., Mucciarelli, A., Ferraro, F. R., et al. 2015, ApJ, 813, 97 [CrossRef] [Google Scholar]
- Li, H., Aoki, W., Matsuno, T., et al. 2018, ApJ, 852, L31 [NASA ADS] [CrossRef] [Google Scholar]
- Lind, K., Asplund, M., Barklem, P. S., & Belyaev, A. K. 2008, A&A, 528, 103 [Google Scholar]
- Lind, K., Primas, F., Charbonnel, C., Grundahl, F., & Asplund, M. 2009, A&A, 503, 545 [NASA ADS] [CrossRef] [EDP Sciences] [MathSciNet] [Google Scholar]
- Lind, K., Asplund, M., Barklem, P. S., & Belyaev, A. K. 2011, A&A, 528, A103 [NASA ADS] [CrossRef] [EDP Sciences] [Google Scholar]
- Marino, A. F., Milone, A. P., Piotto, G., et al. 2011, ApJ, 731, 64 [NASA ADS] [CrossRef] [Google Scholar]
- McDonough, W. F. 2001, in Earthquake Thermodynamics and Phase Transitions in the Earth’s Interior, International Geophysics Series, eds. R. Teisseyre & E. Majewski (Cambridge, MA: Academic Press), 76, 3 [CrossRef] [Google Scholar]
- Monaco, L., Villanova, S., Bonifacio, P., et al. 2012, A&A, 539, A157 [NASA ADS] [CrossRef] [EDP Sciences] [Google Scholar]
- Monaco, L., Villanova, S., Carraro, G., Mucciarelli, A., & Moni Bidin C. 2018, A&A, 616, A181 [NASA ADS] [CrossRef] [EDP Sciences] [Google Scholar]
- Mott, A., Steffen, M., Caffau, E., Spada, F., & Strassmeier, K. G. 2017, A&A, 604, A44 [NASA ADS] [CrossRef] [EDP Sciences] [Google Scholar]
- Mucciarelli, A. 2013 [arXiv:1311.1403] [Google Scholar]
- Mucciarelli, A., Origlia, L., Ferraro, F. R., & Pancino, E. 2009, ApJ, 695, L134 [NASA ADS] [CrossRef] [Google Scholar]
- Mucciarelli, A., Salaris, M., & Bonifacio, P. 2012, MNRAS, 419, 2195 [NASA ADS] [CrossRef] [Google Scholar]
- Mucciarelli, A., Pancino, E., Lovisi, L., Ferraro, F. R., & Lapenna, E. 2013, ApJ, 766, 78 [NASA ADS] [CrossRef] [Google Scholar]
- Mucciarelli, A., Salaris, M., Monaco, L., et al. 2018, A&A, 618, A134 [NASA ADS] [CrossRef] [EDP Sciences] [Google Scholar]
- Norris, J. E. 2004, ApJ, 612, L25 [NASA ADS] [CrossRef] [Google Scholar]
- Palmerini, S., Cristallo, S., Busso, M., et al. 2011, ApJ, 741, 26 [NASA ADS] [CrossRef] [Google Scholar]
- Pasquini, L., Avila, G., Allaert, E., et al. 2000, SPIE, 4008, 129 [Google Scholar]
- Pasquini, L., Bonifacio, P., Molaro, P., et al. 2005, A&A, 441, 549 [NASA ADS] [CrossRef] [EDP Sciences] [Google Scholar]
- Pasquini, L., Koch, A., Smiljanic, R., Bonifacio, P., & Modigliani, A. 2014, A&A, 563, A3 [NASA ADS] [CrossRef] [EDP Sciences] [Google Scholar]
- Piotto, G., Bedin, L. R., Anderson, J., et al. 2005, ApJ, 621, 777 [NASA ADS] [CrossRef] [Google Scholar]
- Ruchti, G. R., Fulbright, J. P., Wyse, R. F. G., et al. 2011, ApJ, 743, 107 [NASA ADS] [CrossRef] [Google Scholar]
- Sackmann, I.-J., & Boothroyd, A. I. 1999, ApJ, 510, 217 [NASA ADS] [CrossRef] [Google Scholar]
- Siess, L., & Livio, M. 1999, MNRAS, 308, 1133 [NASA ADS] [CrossRef] [Google Scholar]
- Skrutskie, M. F., Cutri, R. M., Stiening, R., et al. 2006, AJ, 131, 1163 [NASA ADS] [CrossRef] [Google Scholar]
- Smith, V. V., Shetrone, M. D., & Keane, M. J. 1999, ApJ, 516, L73 [NASA ADS] [CrossRef] [Google Scholar]
- Sollima, A., Pancino, E., Ferraro, F. R., et al. 2005, ApJ, 634, 332 [NASA ADS] [CrossRef] [Google Scholar]
- Stetson, P. B.,& Pancino, E. 2008, PASP, 120, 1332 [Google Scholar]
- Sweigart, A. V., & Mengel, J. G. 1979, ApJ, 229, 624 [NASA ADS] [CrossRef] [Google Scholar]
- Ventura, P., & D’Antona, F. 2010, MNRAS, 402, 72 [Google Scholar]
- Ventura, P., & D’Antona, F. 2011, MNRAS, 410, 2760 [NASA ADS] [CrossRef] [Google Scholar]
- Villanova, S., Geisler, D., Carraro, G., Moni Bidin, C., & Munoz, C. 2013, ApJ, 778, 107 [NASA ADS] [CrossRef] [Google Scholar]
- Willman, B., & Strader, J. 2012, AJ, 144, 76 [NASA ADS] [CrossRef] [Google Scholar]

All Tables
All Figures
|
Fig. 1 Resonance Li line in #25664 (left upper panel, red line) and #126107 (right upper panel, blue line) both compared with stars of Omega Centauri of similar metallicity and atmospheric parameters (M2018). Lower panel: comparison between the Na I D lines in #25664 and in the comparison star. Plus symbols indicate the interstellar Na D2 lines. |
| In the text | |
|
Fig. 2 Na I doublet at 6154-6160 Å in #25664 (red line) compared with the spectrum of the star #186775 (black line). |
| In the text | |
|
Fig. 3 Behaviour of [Na/Fe]NLTE as a function of [Fe/H] for the LRGB stars of Omega Centauri (grey circles, M2018). The red and blue triangles indicate the position of #25664 and #126107, respectively. |
| In the text | |
|
Fig. 4 Behaviour of [Na/Fe]NLTE as a function of |
| In the text | |
|
Fig. 5 Behaviour of A(Li) as a function of log g for the stars in Omega Centauri (grey circles, M2018), in the two Li-rich stars discussed here (red and blue triangles), in the Li-rich stars discovered so far in GCs (green circles, squared symbols are the stars for which [Na/Fe] has been measured), and the GC NGC 6397 (black circles, Lind et al. 2009). |
| In the text | |
|
Fig. A.1 (V, V –I) colour–magnitude diagram of Omega Centauri obtained from the WFI catalogue by Bellini et al. (2009) with the position of the two Li-rich stars marked (red circle for #25664 and blue circle #126107). The arrow indicates the luminosity level of the RGB Bump of the metal-poor, dominant population of Omega Centauri. |
| In the text | |
|
Fig. A.2 (G, BP–RP) colour–magnitude diagram of Omega Centauri obtained with Gaia Data Release 2 (Gaia Collaboration 2018) with the position of the two Li-rich stars marked (same colours and symbols of Fig. A.1). |
| In the text | |
|
Fig. A.3 Left panels: behaviour of the abundance of Fe I lines as function of the excitation potential χ for the Li-rich stars, red circles for #25664 (upper left panel) and blue circles for #126107 (lower left panel). Right panels: spectral region around a Fe I line in #25664 (upper right panel, red line) and #126107 (lower right panel, blue line), both compared with stars in Omega Centauri with similar metallicity and atmospheric parameters as shown in Fig. 1. |
| In the text | |
Current usage metrics show cumulative count of Article Views (full-text article views including HTML views, PDF and ePub downloads, according to the available data) and Abstracts Views on Vision4Press platform.
Data correspond to usage on the plateform after 2015. The current usage metrics is available 48-96 hours after online publication and is updated daily on week days.
Initial download of the metrics may take a while.