Fig. A.3
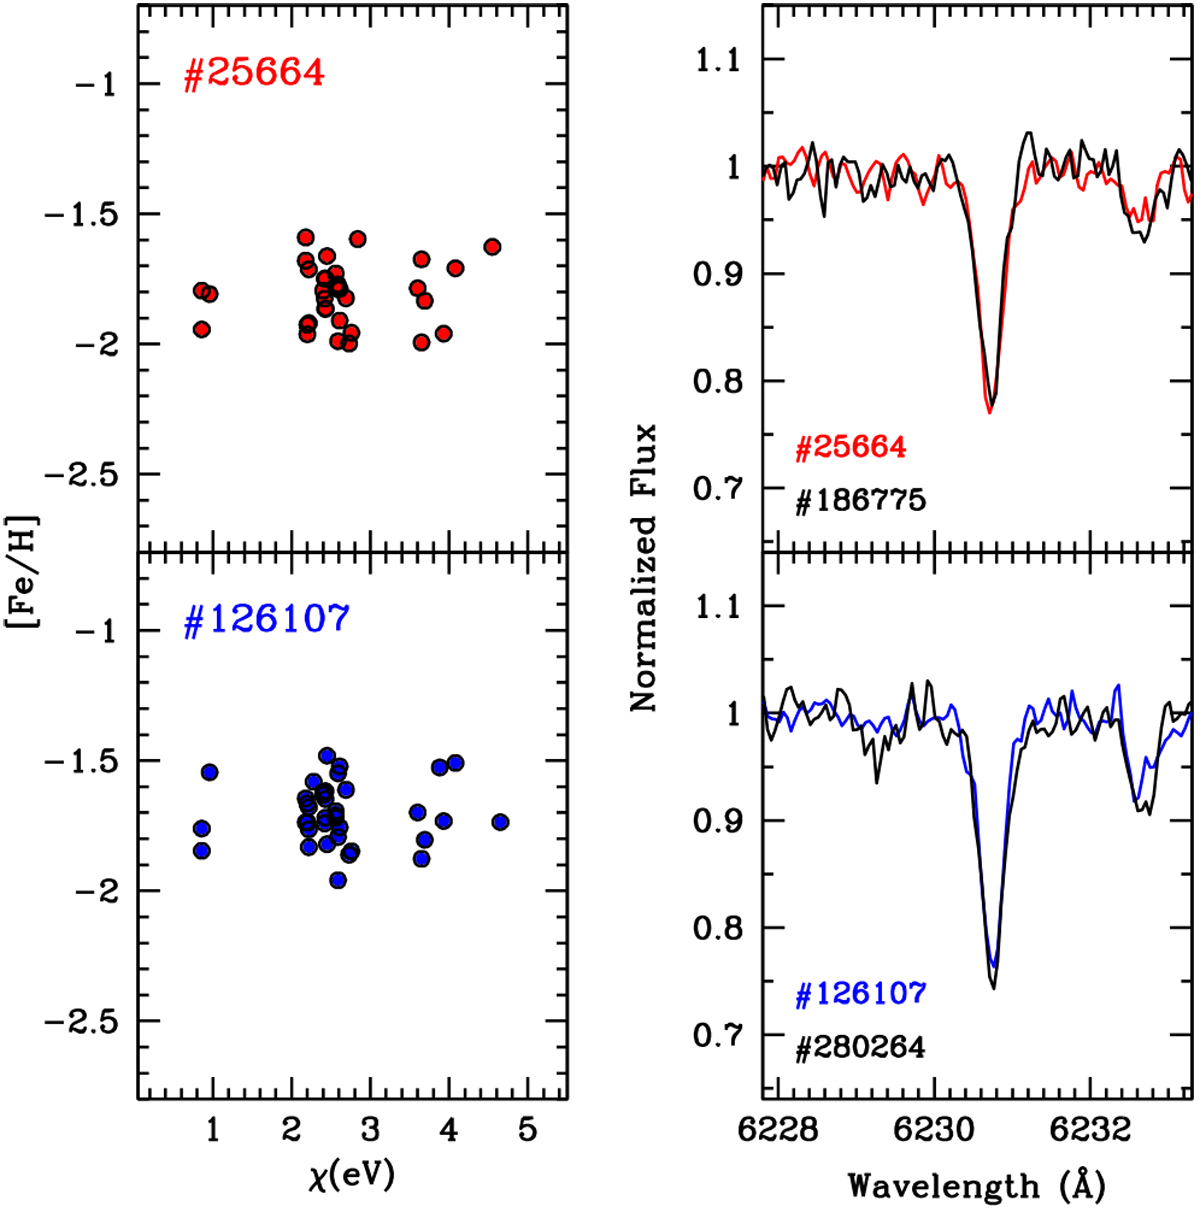
Left panels: behaviour of the abundance of Fe I lines as function of the excitation potential χ for the Li-rich stars, red circles for #25664 (upper left panel) and blue circles for #126107 (lower left panel). Right panels: spectral region around a Fe I line in #25664 (upper right panel, red line) and #126107 (lower right panel, blue line), both compared with stars in Omega Centauri with similar metallicity and atmospheric parameters as shown in Fig. 1.
Current usage metrics show cumulative count of Article Views (full-text article views including HTML views, PDF and ePub downloads, according to the available data) and Abstracts Views on Vision4Press platform.
Data correspond to usage on the plateform after 2015. The current usage metrics is available 48-96 hours after online publication and is updated daily on week days.
Initial download of the metrics may take a while.