Fig. 7.
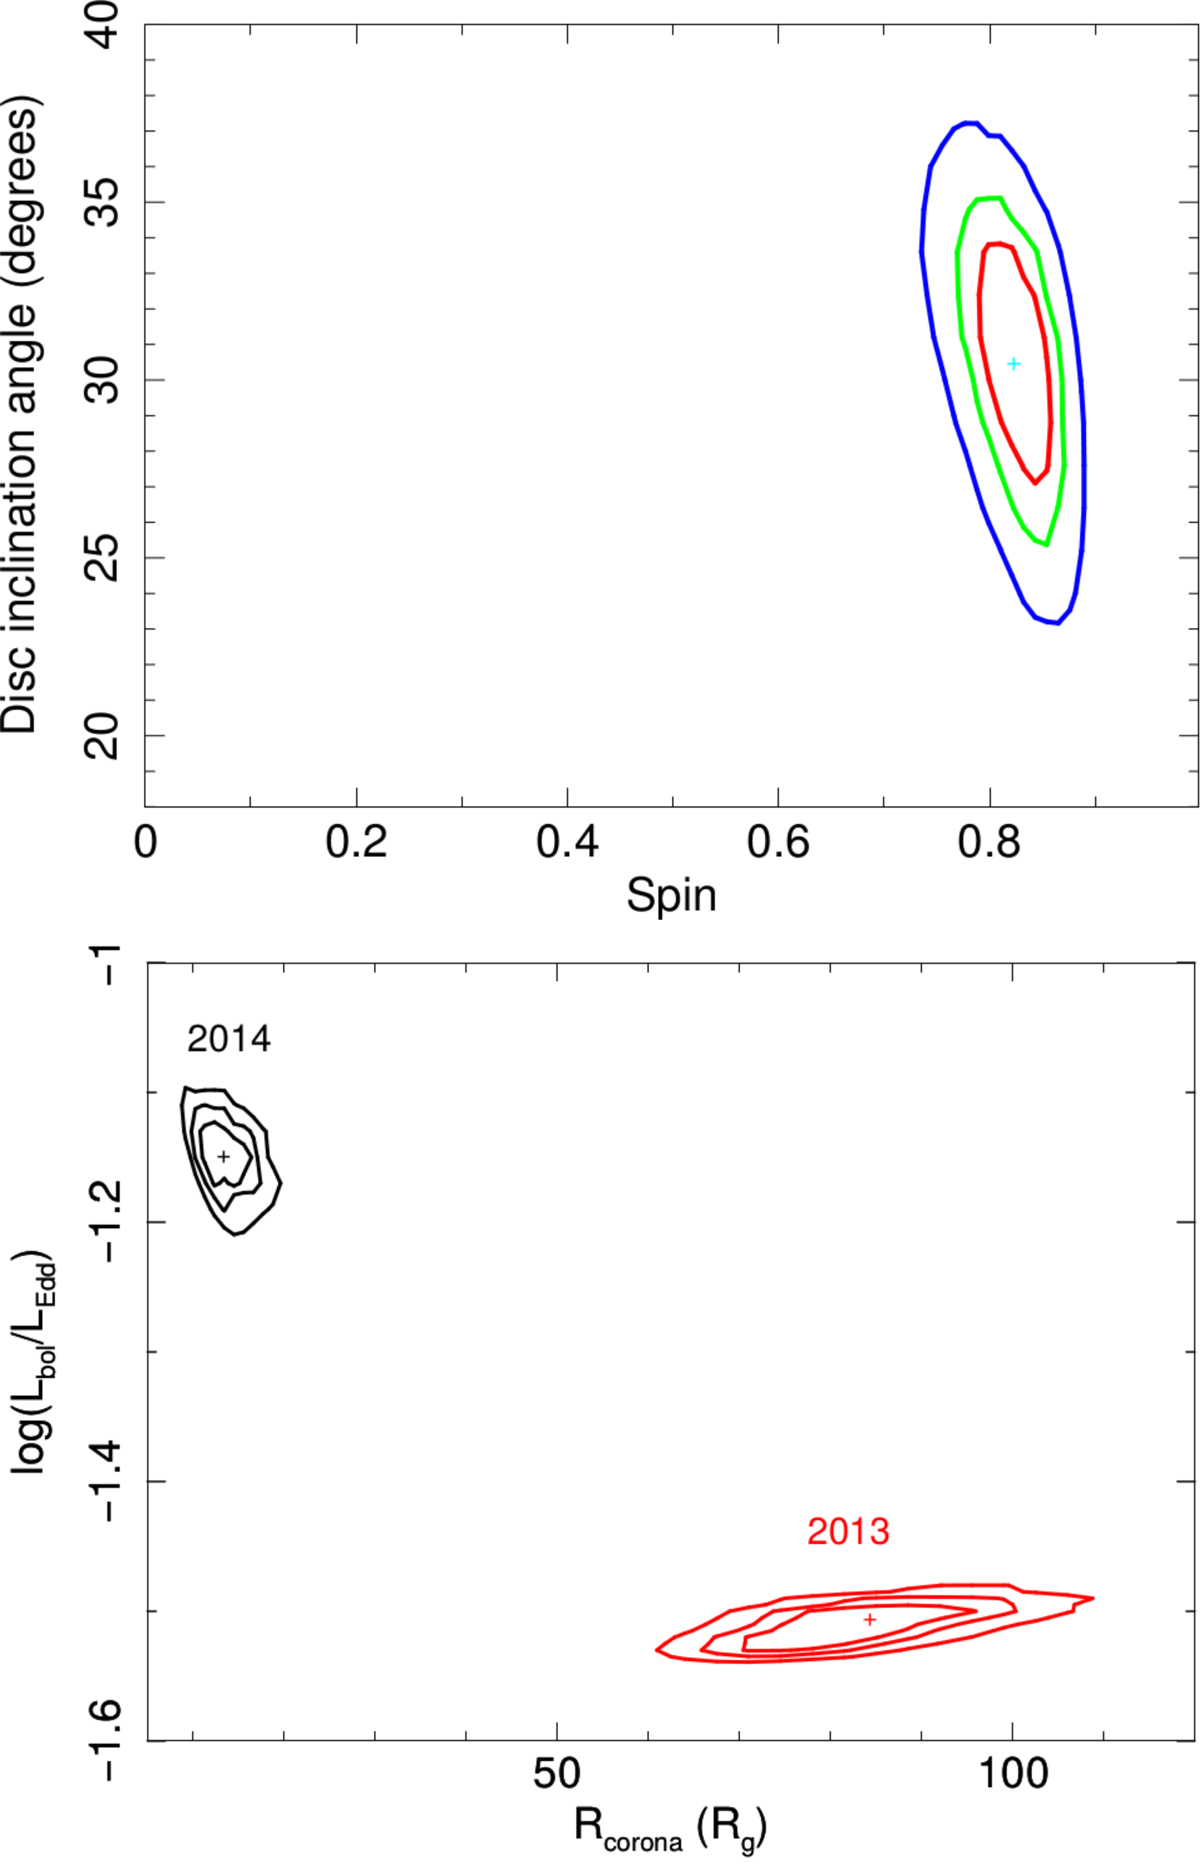
2D contour plots (at the 68%, 90% and 99% confidence levels) from the simultaneous fit of the 2013 and 2014 observations. Top panel: disc inclination angle versus spin. Bottom panel: log(Lbol/LEdd) versus Rcorona (expressed in Rg) found for the 2014 observation (high-flux state, in black) and for the 2013 observation (low-flux state, in red).
Current usage metrics show cumulative count of Article Views (full-text article views including HTML views, PDF and ePub downloads, according to the available data) and Abstracts Views on Vision4Press platform.
Data correspond to usage on the plateform after 2015. The current usage metrics is available 48-96 hours after online publication and is updated daily on week days.
Initial download of the metrics may take a while.