Fig. 3.
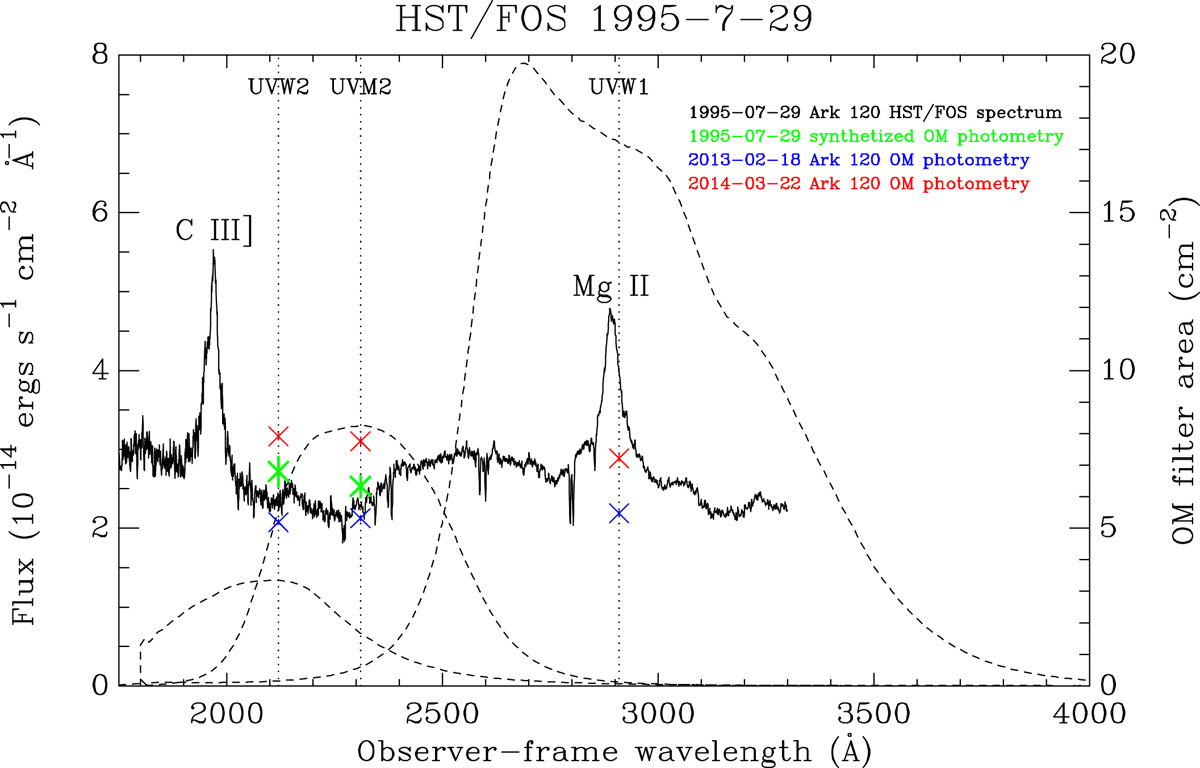
Wavelength coverage of the UV emission of Ark 120 with the OM broad-band UV-filters. The continuous line is the observed UV spectrum of Ark 120 obtained with the Hubble Space Telescope Faint Object Spectrograph (HST/FOS) on 1995 July 29 (Kuraszkiewicz et al. 2004), where the main broad emission lines are labelled. The faint absorption lines are galactic in origin (Crenshaw et al. 1999). The dashed lines are the OM filter areas. The green data are the synthetised photometry that we computed from this HST/FOS spectrum using the OM broad-band UV-filter profiles. The red and blue data are the observed mean UVW2, UVM2, and UVW1 fluxes from the corrected observed mean count rates on 2014 March 22 and on 2013 February 18, respectively (Lobban et al. 2018).
Current usage metrics show cumulative count of Article Views (full-text article views including HTML views, PDF and ePub downloads, according to the available data) and Abstracts Views on Vision4Press platform.
Data correspond to usage on the plateform after 2015. The current usage metrics is available 48-96 hours after online publication and is updated daily on week days.
Initial download of the metrics may take a while.