Fig. 1.
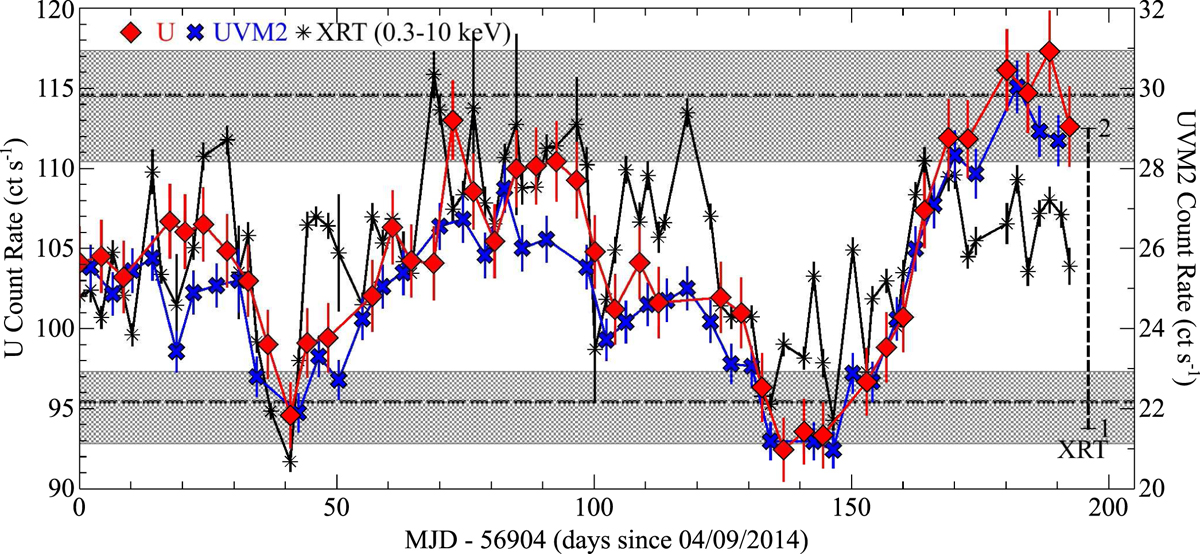
The Swift UVOT light curve of Ark 120 showing the corrected count rates in the U (red) and UVM2 (blue) bands (adapted from Lobban et al. 2018). Each point corresponds to a single image observation. The 0.3–10 keV XRT light curve (black) is overlaid with an additional y-axis scale. The lower and upper grey shaded areas correspond to the XRT count rates at the 2013 and 2014 XMM-Newton 0.3–10 keV fluxes, respectively. The horizontal dashed lines correspond to the mean flux for each dataset.
Current usage metrics show cumulative count of Article Views (full-text article views including HTML views, PDF and ePub downloads, according to the available data) and Abstracts Views on Vision4Press platform.
Data correspond to usage on the plateform after 2015. The current usage metrics is available 48-96 hours after online publication and is updated daily on week days.
Initial download of the metrics may take a while.