Open Access
Fig. 5.
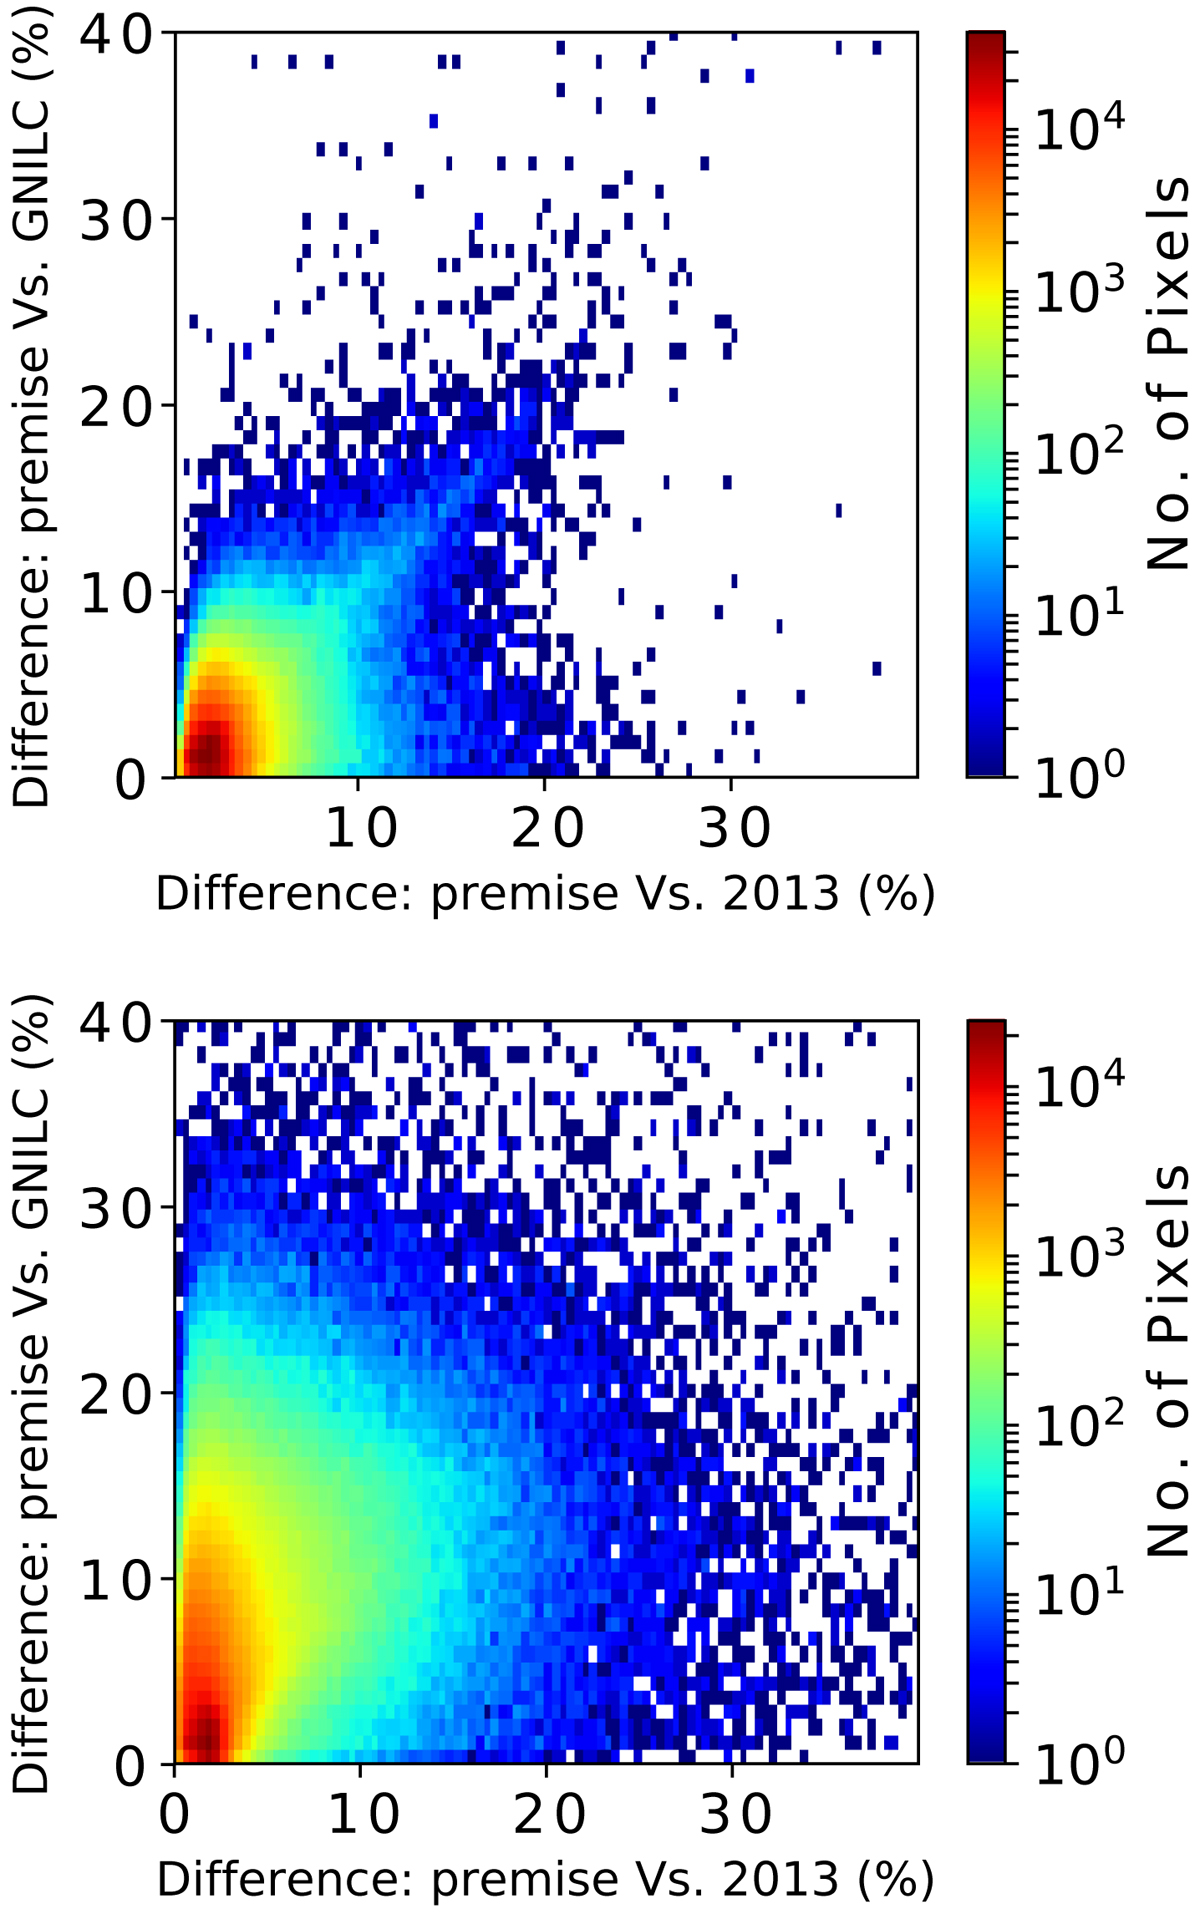
Percentage difference between the premise and GNILC temperature values against the percentage difference between the premise and 2013 temperature values (top panel). The same as the top figure but for spectral indices (bottom panel).
Current usage metrics show cumulative count of Article Views (full-text article views including HTML views, PDF and ePub downloads, according to the available data) and Abstracts Views on Vision4Press platform.
Data correspond to usage on the plateform after 2015. The current usage metrics is available 48-96 hours after online publication and is updated daily on week days.
Initial download of the metrics may take a while.