| Issue |
A&A
Volume 623, March 2019
|
|
|---|---|---|
| Article Number | A177 | |
| Number of page(s) | 7 | |
| Section | Stellar structure and evolution | |
| DOI | https://doi.org/10.1051/0004-6361/201834032 | |
| Published online | 28 March 2019 | |
Nature of blackbody stars
1
Institute of Space Sciences (ICE, CSIC) Campus UAB, Carrer de Can Magrans, s/n, 08193 Bellaterra, Spain
e-mail: This email address is being protected from spambots. You need JavaScript enabled to view it.
2
Institut d’Estudis Espacials de Catalunya (IEEC), C/Gran Capita, 2-4, 08034 Barcelona, Spain
3
Instituto de Ciencias Astronómicas, de la Tierra y del Espacio (CONICET), Av. España 1512 (sur), 5400 San Juan, Argentina
4
Kavli Institute for the Physics and Mathematics of the Universe, University of Tokyo, Kashiwa 277-8583, Japan
5
Institute for Advanced Study, Princeton 08540, NJ, USA
Received:
6
August
2018
Accepted:
7
February
2019
Abstract
A selection of 17 stars in the Sloan Digital Sky Survey, previously identified as DC-class white dwarfs (WDs), has been reported to show spectra very close to blackbody radiation in the wavelength range from ultraviolet to infrared. Because of the absence of lines and other details in their spectra, the surface gravity of these objects has previously been poorly constrained, and their effective temperatures have been determined by fits to the continuum spectrum using pure helium atmosphere models. We computed model atmospheres with pure helium and H/He mixtures and used Gaia DR2 parallaxes that are available for 16 of the 17 selected stars to analyze their physical properties. We find that the atmospheres of the selected stars are very probably contaminated with a trace amount of hydrogen of −6 ≤ log(NH/NHe) ≤ −5.4. For the 16 stars with Gaia parallaxes, we calculate a mean stellar mass 0.606 ± 0.076 M⊙, which represents typical mass values and surface gravities (7.8 < logg < 8.3) for WDs.
Key words: white dwarfs / stars: atmospheres / stars: evolution / opacity
© ESO 2019
1. Introduction
DC-type white dwarfs (WDs) comprise degenerate stars showing only continuous spectra that are commonly attributed to helium-rich atmospheres with an effective temperature (Teff) lower than ≈11 000 K. Specifically, they have long been recognized as descendants of DB-class stars (WDs with He I lines and no other elements in their spectra) as they cool down below the spectral line detection (Baglin & Vauclair 1973). It was also suggested by Baglin & Vauclair that some DC WDs could be a result of the mixing in convective DA stars (which have almost pure H atmospheres). This process was proposed to explain the so-called non-DA gap in the range 5000 K ≲ Teff ≲ 6000 K, where only few non-DA stars are found (Bergeron et al. 1997). Using evolutive models and statistical analysis, Chen & Hansen (2012) showed that such a deficit could originate from a combination of convective mixing and a higher cooling rate of the post-mixing WDs. In addition, recent studies have shown a bifurcation of helium- and hydrogen-atmosphere cooling sequences on color-magnitude diagrams of Sloan Digital Sky Survey (SDSS) and Gaia passbands (Gaia Collaboration 2018a; Kilic et al. 2018) with both sequences coinciding below Teff ≈ 7000 K, where a high number of DC stars are confined. The observed split in the two sequences might be due not only to atmospheric composition, but also to an effect of the stellar mass distribution (Kilic et al. 2018). Clearly, further work is necessary to understand the role of DC stars in the chemical evolution of cool WD atmospheres.
Recently, Suzuki & Fukugita (2018, hereafter SF18) have identified a group of stars that exhibit almost perfect blackbody spectra with no apparent absorption lines, which SF18 referred to as blackbody stars and which we refer to here as the SF18 sample or SF18 stars. Their study included mainly spectrophotometric data of the SDSS in DR7, but was also supplemented with ultraviolet photometry of Galaxy Evolution Explorer (GALEX) and infrared data of the Wide-field Infrared Survey Explorer (WISE). The selected group of objects, composed of 17 stars that mimic the blackbody emission, were previously classified as DC WDs in a number of studies based on spectral, photometric, and kinematics analyses (Kleinman et al. 2004, 2013; Eisenstein et al. 2006; Kepler et al. 2015; Gentile Fusillo et al. 2015). The potential interest of this sample relies on the simplicity of their spectral energy distributions, which makes them excellent objects for calibration purposes of photometric (SF18) and spectroscopic surveys (Lan et al. 2018; Narayan et al. 2019). Any deviations of the SF18 stars from blackbody colors from infrared to UV are very small. The lack of spectral features prevents an accurate evaluation of the surface gravity (g), and previous effective temperature evaluations have been based on photometric and continuum spectrum fits with pure helium models. However, it is particularly unclear whether the continuum spectrum of pure-He atmosphere WDs can lead to a spectral energy distribution that mimics that of a blackbody spectrum in the whole temperature range covered by the SF18 sample so well. A study of these stars might also provide further insight about the chemical evolution of cool WDs. Furthermore, this subpopulation of DC stars could also open a novel possibility of testing our understanding of cool, high-density stellar atmospheres.
In this work we study the stellar parameters of the SF18 sample by considering the spectral properties of WD model atmospheres computed with different assumptions regarding their composition. We find that pure-He atmosphere models produce a blackbody spectrum that matches the observed sample of DC stars, but the models require high surface gravities for the cooler stars. Atmospheres dominated by helium that contain a trace amount of hydrogen can also reproduce the data very well, with log g values more typical for WDs. The effective temperature of the models that fit best these stars differs from the estimated blackbody temperature (TBB) due to opacity effects, however. The difference between these temperatures depends on the blackbody temperature as well as on the amount of hydrogen pollution of the atmosphere. The inclusion of the Gaia data allows us to determine the physical parameters of these stars, their temperature, radius, mass, and surface gravity to a good precision with the aid of atmosphere models. This removes the ambiguity that arises when only photometry is avaliable. We find the mass distribution of this sub-group of DC stars to be similar to that of (hotter) DB stars. This supports the hypothesis that this sample of DC stars consists of cooler descendants of DBs.
The layout of the paper is as follows. In Sect. 2 we briefly review the model atmospheres used in this work. In Sect. 3 we show that models with pure-He composition or very low hydrogen pollution reproduce the blackbody properties of the SF18 stars, and in Sect. 4 we determine the stellar parameters of the stars. In Sect. 5 we discuss our results in the context of the evolution of DB and DC stars, as well as the potential use of the SF18 sample as calibrators for both photometric and spectroscopic surveys. Finally, a summary and conclusions are presented in Sect. 6.
2. WD atmosphere models
The white dwarf model atmospheres used in this work have been computed within the assumption of plane-parallel geometry, local thermal equilibrium (LTE), and radiative-convective and hydrostatic equilibrium. Convective energy transport is treated in the mixing-length approximation (ML2; e.g., Salaris & Cassisi 2008). Particle populations for a mixture of hydrogen and helium (H, H2, H+, H−,  ,
,  , He, He−, He+, He++,
  , HeH+, and e−) are derived from the occupation probability formalism. All relevant radiative opacities are considered. Details of the code can be found in Rohrmann et al. (2012) and references therein. We use two classes of models according to composition: pure-He, and He-dominated atmospheres with H abundances log(NH/NHe) = −2, …, −8.5. Results for pure hydrogen atmospheres are also considered but only for reference.
3. SF18 stars in the color-color plane
We present in Fig. 1 the (u − g) vs. (g − r) color-color diagram for WDs from the SDSS DR7 WD catalog (Kleinman et al. 2013), where u, g, r are the SDSS color bands (Fukugita et al. 1996). We include DB (He 1 4471 Å) and DC (featureless spectrum) with the spectroscopic classification taken from the original catalog. Randomly selected samples are shown for each class to avoid overcrowding the plot. The 17 stars of the SF18 sample are shown as black data points with error bars.
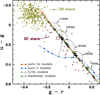 |
Fig. 1. Color–color diagram for a sample of WD stars from the SDSS DR7 catalog (Kleinman et al. 2013). The SF18 sample is shown with error bars. Lines denote theoretical color-color curves for blackbody (green short-dashed), pure-He (red solid), pure-H (blue long-dashed), and mixed H/He (dotted) atmosphere models as indicated in the figure legend, in the range 14 000–7000 K. Small circles on top of the curves show blackbody, He atmosphere, and H atmosphere models with marks indicating 1000 K intervals. The circles on the bridging between H and He models mark the log(NH/NHe) = −2, −4, −6 values. |
Figure 1 includes theoretical predictions for different classes of WD atmosphere models characterized by their composition. The orange solid line represents the predictions of pure-He atmosphere models for varying Teff from about 14 000 K (upper left mark) down to 7000 K (lower right mark) with a 1000 K step. The colors of pure-H atmospheres are very different from a blackbody spectrum in the temperature range of interest. These models are shown with blue long-dashed lines in Fig. 1. Colors of atmospheres composed of H/He mixtures vary with the relative abundance of H with respect to He. The dotted lines in the figure denote sequences of models with constant Teff and a decreasing amount of hydrogen from pure-H to pure-He model atmospheres. Here, yellow circle ticks denote log(NH/NHe) = −2, −4, and −6. When the H/He ratio decreases to log(NH/NHe) ≲ −6, they closely approach the pure-He models, within the photometric uncertainties of the SF18 sample. It is to be noted that for log(NH/NHe) ≲ −6 hydrogen lines remain hidden in helium-rich atmospheres; the equivalent width of Hα drops below ∼0.2 Å (Weidemann & Koester 1995). All models in the figure correspond to logg = 8: (u − g) and (g − r) colors from pure-He atmospheres depend very weakly on logg. Finally, the green short-dashed line represents results for blackbody spectra. Circle ticks represent temperature intervals of 1000 K.
The SF18 sample falls exactly on top of the blackbody predictions. This is the result of the selection of stars by SF18, in which a star with a spectrum that deviated substantially from a blackbody was discarded. All stars in the sample have a blackbody temperature TBB between 7000 K and 12 000 K, defined as the temperature of a blackbody that reproduces all observed colors. In this temperature range, colors from pure-He models almost perfectly overlap with blackbody colors. This is also true for models with log(NH/NHe) = −6. At hotter (g − r < −0.15) temperatures, pure-He model predictions start to deviate from the blackbody results. The same is true for the cooler temperatures (g − r > 0.25), as shown below in Fig. 2. These results support the identification of stars in the sample as DC stars either with pure-He envelopes or with a very small amount of H. On the other hand, it is evident from the figure that DC stars do not always display colors that match those of a blackbody, and in this regard, the SF18 sample represents a peculiar minority of the whole DC population. We note that DC is a label of observational classification that implies the absence of spectral features. While this is usually understood to be due to He-dominated atmospheres, it includes stars with trace abundances of other chemical elements with abundances low enough to show no spectral lines but large enough to affect the shape of the continuum.
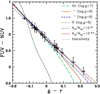 |
Fig. 2. (FUV − NUV)−(g − r) color–color diagram. Stars in the SF18 sample are shown as black dots with error bars. Lines denote theoretical models as indicated in the legend. Models with H/He mixtures correspond to logg = 8. The H/He models with log(NH/NHe) = −5.4 reproduce all data of stars in the SF18 sample. |
It is possible that the SF18 sample is formed by DQ stars with very small traces of carbon that are too low to have any discernible feature in SDSS spectra. Koester & Knist (2006) have shown that in C/He atmospheres the effect of carbon in the (u − g) vs. (g − r) plane vanishes for log(NC/NHe) < −8 in the temperature range of the SF18 stars. Spectroscopically, the lowest carbon abundance measured in DQ stars is log(NC/NHe) ≈ −7.5 (Koester & Knist 2006; Kepler et al. 2015). On the other hand, evolutionary models (Camisassa et al. 2017) indicate that stars with initially pure-He envelopes undergo a rapid enrichment of carbon due to dredge-up as stars cool down from Teff ≈ 12 500 K to 7000 K. The carbon abundance then increases up to log(NC/NHe) ≈ −3 for WD models of different stellar mass. However, in order for the SF18 stars to have a C abundance that is below the detectability level but large enough to affect colors, a finely tuned competition between dredge-up and gravitational sedimentation has to occur throughout this effective temperature range. This possibility is made even less probable by the fact that the sample includes stars of similar mass and effective temperatures that differ by a few thousand degrees, a range over which models show much larger variations in surface C abundances than allowed by detectability limits.
The comparison between models and data is more revealing when UV bands are included. Figure 2 compares the SF18 sample with our models in the Galex (FUV − NUV) vs. (g − r) plane. All stars are perfectly matched to the blackbody color due to their selection criterion in SF18, which included UV photometry. Pure-He models also provide a good description of the data for stars bluer than (g − r) = 0.1. For cooler stars with (g − r)> 0.1, however, the logg = 8 canonical pure-He model deviates from the blackbody results and in particular does not reproduce the three coolest stars. UV colors from pure-He models show a higher sensitivity to logg than optical colors, and models with logg = 9 remain close to blackbody colors at cooler temperatures. This would suggest that the cool stars could be quite massive WDs with masses around 1.2 M⊙, that is, in the realm of WDs with ONe or CO-Ne hydrid cores rather than typical CO cores (Althaus et al. 2005; Doherty et al. 2017). A more satisfactory result is found with the H/He models with log(NH/NHe) = −5.4, −6 also shown in Fig. 2. These models at logg = 8 reproduce colors of the SF18 sample better than pure-He models across the whole range, corresponding to typical WD masses of about 0.6 M⊙ in agreement with the mean mass value for DBs (e.g., Koester & Kepler 2015). We return to this in the next section, in which we determine stellar parameters using the recent astrometric results of Gaia DR2 (Gaia Collaboration 2018b).
4. Determination of physical parameters
The physical parameters of the stars, in particular radius and mass, can be determined with the aid of model atmospheres, provided their distances are known. The recent Gaia DR2 (Gaia Collaboration 2018b) includes astrometric solutions for 16 of the 17 SF18 stars. We have queried the Gaia DR2 catalog using CosmoHub (Carretero et al. 2017). Parallaxes range between 4.5 and 14 mas, that is, distances between 70 and 230 pc, and errors between 1% and 10% with a mean of 4.5%, not far from end-of-mission expectations. Parallaxes and distances are listed in Table 1.
Physical parameters of the 16 stars in the SF18 sample with Gaia DR2 parallax measurements.
In order to determine the stellar radius, we consider the relation that is valid for SDSS magnitudes:
![Mathematical equation: $$ \begin{aligned} m_b = -2.5 \log {\left[\pi R^2 \varpi ^2\right]} - 2.5 \log {\left[\frac{\int {F_\nu S_{\nu ,b} \mathrm{d}\nu }}{\int {S_{\nu ,b} \mathrm{d}\nu }}\right]} - 48.60, \end{aligned} $$](/articles/aa/full_html/2019/03/aa34032-18/aa34032-18-eq4.gif) (1)
(1)
where mb is the observed magnitude in a given band b, ϖ is the parallax, R the radius, Fν the astrophysical flux, and Sν, b the passband transmission in band b. From the observed colors, TBB can be derived straightforwardly. In the relation above, Fν depends on the unknown Teff, however. Therefore, model atmospheres are required to relate the observationally determined TBB with Teff, which in turn is used to determine Fν.
The relation between TBB and Teff depends on the physical conditions of the stellar atmosphere. To illustrate this, we compare in Fig. 3 the emerging flux of a Teff = 10 000 K (logg = 8) pure-He atmosphere with a blackbody spectrum also at Teff = 10 000 K, meaning that both models have the same flux  , where σ is the Stefan–Boltzmann constant. The spectrum of the pure-He model is slightly shifted toward the bluer side compared to the blackbody spectrum of the same Teff. The figure also shows the spectrum of a pure-He model at Teff = 9379 K, which mimics the shape of a Teff = 10 000 K blackbody spectrum and hence its colors, but differs in the flux normalization, which is lower by a factor (9379/10 000)4 = 0.774.
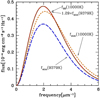 |
Fig. 3. Emerging monochromatic flux. The orange short dashed line shows a pure-He atmosphere with Teff = 10 000 K, the solid green line a blackbody spectrum with Teff = 10 000 K, the blue long dashed line a pure-He atmosphere with Teff = 9379 K, and the red dotted line a pure-He atmosphere with Teff = 9379 K scaled up by a factor 1.29 to match the total flux of a Teff = 10 000 K spectrum. Model atmospheres correspond to logg = 8. |
The blueward shift of the spectrum of pure-He models with respect to a blackbody of the same Teff can be understood from Fig. 4, which shows the different contributions to the opacity of the model with Teff = 9379 K at optical depth τRoss = 1. Opacity is dominated by He− free-free (ff) processes and by bound-free (bf) processes of  as the secondary agent. These opacity sources have a relatively weak dependence on frequency across most of the spectrum up to the dominant ff He− contribution that increases toward longer wavelengths (see Fig. 3). Increased flux-blocking at longer wavelengths shifts the spectrum toward the blue, giving it the shape of a blackbody of higher temperature at the same integrated flux. In the model shown in Fig. 3, bf transitions in
  become the single most important opacity source for frequencies higher than 5 μm−1, and increase for higher frequencies. Therefore, it is expected that colors involving UV bands will show deviations from blackbody atmospheres when bf
  processes become dominant. An increase in the number of free electrons that form He− increases, for instance, at higher densities (higher surface gravities) or by the presence of trace hydrogen, will cause an increase in ff He− opacity, which keeps the total opacity closer to gray opacity. This is relevant for understanding the impact of gravity or hydrogen pollution in He-dominated atmospheres, and it is the main reason for the results in Fig. 2.
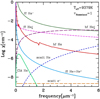 |
Fig. 4. Individual opacity contributions at τRoss = 1 in a cool pure-He WD atmosphere. Dominant contributions are ff processes of He− and |


Figure 5 shows in the top three panels the color difference between a blackbody and the model atmospheres that best adjust colors for different log(NH/NHe) values. Results for pure-He models are shown as red dotted lines for models with log(NH/NHe) = −6 in solid blue lines and for the best-fit models with varying log(NH/NHe) in dashed orange. Differences are shown as a function of the inferred TBB (color temperature) value. Circles denote residuals of the best blackbody fit to the SF18 stars. The log(NH/NHe) values of the best-fit models are shown in the fourth panel, where the curve for log(NH/NHe) = −6 is given for reference. Here we note that the best-fit models have in most cases log(NH/NHe) = −5.4, which is somewhat above our adopted formal spectroscopic detection limit. However, it is apparent that the models with lower log(NH/NHe) values also reproduce the blackbody colors with residuals that are lower than the differences between colors of the SF18 stars and a blackbody spectrum.
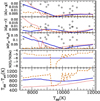 |
Fig. 5. Top three panels: absolute difference of colors between blackbody spectrum and pure-He atmospheres (red dotted), log(NH/NHe) = −6 models (solid blue), and best-fit model (dashed orange). Circles denote residuals for the SF18 stars. Fourth panel from top: log(NH/NHe) values for the best-fit model (dashed orange) and log(NH/NHe) = −6 (solid blue, constant). Lower panel: TBB − Teff as a function of blackbody temperature and hydrogen abundance for pure-He, log(NH/NHe) = −6, and best-fit models. |
We note that the temperature for the SF18 stars may be somewhat lower, by 100E(B − V))/0.01 K, when extinction to these local WDs is taken into account (SF18), while E(B − V) is typically 0.02 mag/(100 pc) in the solar neighborhood. It is difficult to determine extinction for individual WDs from photometry because extinction is nearly parallel to the change in temperature. Extinction hardly affects the extent of the deviation of stars from these stars from the blackbody curve.
In order to determine R from Eq. (1), we have used three different sets of model atmospheres: (1) He-pure with logg = 8, (2) He-pure with logg = 9, and (3) log(NH/NHe) = −6 and logg = 8. For each case the difference TBB − Teff can be approximated analytically to better than 30 K as
 (2)
(2)
where x = TBB − 10 000. Results are shown in Fig. 6, where red circles, blue squares, and black crosses correspond to Teff and radius estimates based on cases 1, 2, and 3, respectively. For a given star, the different radii reflect the different Teff estimates through the relation  , where C is a constant. This simple relation between Teff and R is the result of the shape of Fν being the same for all models that reproduce the colors of the star (see Sect. 2), so that the second term in Eq. (1) only depends on the normalization of Fν, given by
  . The figure also shows the evolutionary track of a CO-core 0.606 M⊙ DB model, corresponding to ⟨MDB⟩ (Koester & Kepler 2015), and a track of an ONe-core 1.16 M⊙ WD model. In addition, curves of constant gravity determined from evolutionary tracks are also shown for the two regimes. CO-core models are from Camisassa et al. (2017) and ONe-core models from Althaus et al. (2005). Error bars, shown for one case only, are determined using photometric uncertainties from SF18, Gaia DR2 parallax errors and Teff errors from the uncertainties in fitting (u − g), (g − r), (FUV − NUV) colors.
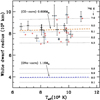 |
Fig. 6. Teff and radius of stars in the SF18 sample with measured Gaia parallaxes. Results for different sets of model atmospheres are shown as red circles (logg = 8, He-pure models), blue squares (logg = 9, pure-He models), and black dots with error bars (logg = 8, log(NH/NHe) = −6). Overlaid with long dashed lines are theoretical WD evolutionary tracks for 0.606 M⊙ (CO-core) and 1.16 M⊙ (ONe-core) WD models. Short dashed lines show curves of constant logg determined from evolutionary models. |
Results in Fig. 6 show that regardless of the assumptions underlying the model atmospheres used, the radii of all the stars are consistent with them being CO WDs, ruling out that they are massive WDs. Radii estimated with logg = 8 models and log(NH/NHe) = −6 are systematically larger than those obtained using He-pure models with the same logg, and the difference increases toward lower temperatures. This reflects that for given TBB, Teff is lower for log(NH/NHe) = −6 models (bottom panel in Fig. 5).
Our results show that by combining photometric and astrometric data, observational properties of stars in the SF18 sample are well described by logg = 8 and log(NH/NHe) = −6 WD atmosphere models. We therefore use stellar radii determined using these models as our reference values to determine further properties, logg and mass, of the SF18 stars. Our derivations make use of the DB evolutionary tracks from Camisassa et al. (2017). Final results are reported in Table 1.
5. Discussion
Figure 7 compares our Teff and logg determinations, in blue with error bars, with previous results from the literature (Eisenstein et al. 2006; Kleinman et al. 2013; Kepler et al. 2015), based on photometry adopting He-pure model atmospheres without astrometric data. The large scatter in logg found in previous results stems from the difficulty in determining DC stars that lack spectral lines. The inclusion of Gaia parallaxes alone can substantially improve this. It should also be noted that using He-pure model atmospheres affects the determination of Teff, as shown in previous sections.
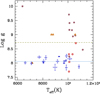 |
Fig. 7. Comparsion of Teff and logg results for the SF18 sample of stars. Blue dots with error bars (this work), open squares (Kleinman et al. 2013), open triangles (Kepler et al. 2015), and open circles (Eisenstein et al. 2006). |
Very recently, Gentile Fusillo et al. (2019, hereafter G19) presented a catalog of WDs with SDSS photometry and Gaia DR2 astrometry. They determined stellar parameters using either H-pure or He-pure model atmospheres for all stars in the catalog. Differences between our Teff and logg determinations with those obtained with He-pure models by G19 are shown in Fig. 8. The difference in Teff determinations propagates to logg because a known distance fixes the stellar flux Fν, so that changes in Teff need to be compensated for by changes in the inferred stellar radius. There are two likely reasons for the difference in the Teff determinations. We have complemented the SDSS ugriz data with Galex UV photometry and used H/He model atmospheres, which are required to reproduce UV colors.
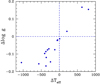 |
Fig. 8. Comparison of Teff and logg in this work and G19. Differences are shown in the sense (this work − G19). |
The mass distribution of our sample has a mean value of ⟨MSF18⟩ = 0.606 M⊙ and a dispersion σMSF18 = 0.075 M⊙. Results from G19, on the other hand, give ⟨MSF18⟩ = 0.651 M⊙ with σ = 0.059 M⊙. The difference arises because G19 used He-pure models. When we repeated our analysis using He-pure model atmospheres, we obtained ⟨MSF18⟩ = 0.649 M⊙. When small traces of H in the atmospheres are neglected, the mass can be overestimated by about 10%, a systematic difference that is larger than the precision with which the stellar mass is determined.
We also compared the mass distribution of our sample with distributions of stars that are available in the literature. Koester & Kepler (2015) has obtained ⟨MDB⟩ = 0.606 M⊙ with 1σ dispersion between 0.04 and 0.1 M⊙ depending on the Teff range analyzed. More recently, using Gaia DR2 parallaxes, Tremblay et al. (2019) reanalyzed the DB sample from Koester & Kepler (2015) and found ⟨MDB⟩ = 0.580 M⊙ with a dispersion of 0.087 M⊙, and the DB sample from Rolland et al. (2018), for which they found ⟨MDB⟩ = 0.588 M⊙ and σ = 0.056 M⊙.
Finally, the close proximity of these stars to the blackbody spectrum motivated us to use them as photometric and spectrophotometric calibrators. Unlike the use of DA WDs (Bohlin et al. 2011; Rauch 2016; Narayan et al. 2019), it is unnecessary to rely on model atmospheres. SF18 used them to verify the zero-points of the photometric system of SDSS across the five-color bands, showing that the deviation of the photometric zero-points is lower than 1% across the u–z bands. This is gratifying since the SDSS photometric system is constructed by combining several elements and hence it is highly desirable to verify the system, which is often taken as the standard when the AB magnitude system is adopted. The SF18 stars also serve as the standard in much wider range of the spectrum relative to the optical, from the far-UV to several microns in the near-IR, for instance, where the absolute standard is not easily available.
6. Conclusions
SF18 have identified a group of stars in SDSS with spectral energy distributions that almost exactly match those of a blackbody. Moreover, they have shown that these stars can be used as excellent calibrators for photometric surveys. We confirm the nature of these stars as DCs, and find strong support that they are the cool descendants of DB WDs. For this, we used optical and UV photometry and Gaia parallaxes to determine the physical parameters 16 of the 17 stars that form the SF18 sample.
We find that these stars are cool He-rich WDs polluted by hydrogen, in the range −6 < log(NH/NHe) < −5.4; they have a typical WD mass. A lower limit is imposed on the hydrogen abundance by the necessary contribution of free electrons so that blackbody colors are reproduced even for the coolest stars in the sample. This effect is particularly important when UV colors are considered. The upper limit is given by the absence of apparent spectral features. The narrow range allowed by these two conditions is a possible reason for the paucity of stars with nearly perfect blackbody colors, such as those in the SF18 sample, in the much larger set of DC WDs.
The inclusion of Gaia parallaxes allows a refined determination of the surface gravity of the stars, which are otherwise poorly constrained because of the lack of spectral lines. We have also shown that He-pure models, which were recently employed in the literature, lead to systematic offsets in logg determinations that can be traced to systematic differences in Teff determinations. Moreover, He-pure models tend to overestimate the masses of these stars by about 10%. It is important to note that these systematic errors might be a common feature affecting the determination of stellar parameters of many, if not all, DC stars because the presence of trace elements can affect on their photometric properties even if they are not detected spectroscopically. The mass distribution for the stars in the SF18 sample agrees very well with that of (hotter) DB stars, which strongly supports the idea that DC stars are their cool descendants.
Finally, we succesfully tested the possibility that has previously been realized and tested in SF18 that the simplicity of the spectral energy distributions of these stars offers very good potential for calibrating photometric and spectroscopic surveys at the sub-percent level. This dispenses with the requirement of relying on stellar model atmospheres.
Acknowledgments
We thank the anonymous referee for the comments that have helped us improve the article. We would like to thank the Max-Planck-Institut für Astrophysik (MPA) where this work was initiated. AS is partially supported by the Spanish Government (ESP2017-82674-R) and Generalitat de Catalunya (2017-SGR-1131). RDR thanks for the support of the MINCYT (Argentina) through Grant No. PICT 2016-1128. MF thanks Hans Böhringer and the late Yasuo Tanaka for the hospitality at the Max-Planck-Institut für Extraterrestrische Physik and Eiichiro Komatsu at MPA, in Garching. He also thanks the Alexander von Humboldt Stiftung for support during his stay in Garching, and the Monell Foundation in Princeton. He received in Tokyo a Grant-in-Aid (No. 154300000110) from the Ministry of Education. Kavli IPMU is supported by World Premier International Research Center Initiative of the Ministry of Education, Japan. This work has made use of CosmoHub developed by the Port d’informacó Científica (PIC), maintained through a collaboration of the Institut de Física d’Altas Energies (IFAE) and the Centro de Investigaciones Energéticas, Medioambientales y Tecnológicas (CIEMAT), and was partially funded by the “Plan Estatal de Investigación Científica y Técnica y de Innovación” program of the Spanish government.
References
- Althaus, L. G., García-Berro, E., Isern, J., & Córsico, A. H. 2005, A&A, 441, 689 [NASA ADS] [CrossRef] [EDP Sciences] [Google Scholar]
- Baglin, A., & Vauclair, G. 1973, A&A, 27, 307 [NASA ADS] [Google Scholar]
- Bergeron, P., Ruiz, M. T., & Leggett, S. K. 1997, ApJS, 108, 339 [NASA ADS] [CrossRef] [Google Scholar]
- Bohlin, R. C., Gordon, K. D., Rieke, G. H., et al. 2011, AJ, 141, 173 [NASA ADS] [CrossRef] [Google Scholar]
- Camisassa, M. E., Althaus, L. G., Rohrmann, R. D., et al. 2017, ApJ, 839, 11 [NASA ADS] [CrossRef] [Google Scholar]
- Carretero, J., Tallada, P., & Casals, J. 2017, in Proceedings of the European Physical Society Conference on High Energy Physics. 5-12 July, 2017 Venice, Italy (EPS-HEP2017). http://pos.sissa.it/cgibin/reader/conf.cgi?confid=314, id.488, 488 [Google Scholar]
- Chen, E. Y., & Hansen, B. M. S. 2012, ApJ, 753, L16 [NASA ADS] [CrossRef] [Google Scholar]
- Doherty, C. L., Gil-Pons, P., Siess, L., & Lattanzio, J. C. 2017, PASA, 34, e056 [NASA ADS] [CrossRef] [Google Scholar]
- Eisenstein, D. J., Liebert, J., Harris, H. C., et al. 2006, ApJS, 167, 40 [NASA ADS] [CrossRef] [Google Scholar]
- Fukugita, M., Ichikawa, T., Gunn, J. E., et al. 1996, AJ, 111, 1748 [NASA ADS] [CrossRef] [Google Scholar]
- Gaia Collaboration (Babusiaux, C., et al.) 2018a, A&A, 616, A10 [NASA ADS] [CrossRef] [EDP Sciences] [Google Scholar]
- Gaia Collaboration (Brown, A. G. A., et al.) 2018b, A&A, 616, A1 [NASA ADS] [CrossRef] [EDP Sciences] [Google Scholar]
- Gentile Fusillo, N. P., Gänsicke, B. T., & Greiss, S. 2015, MNRAS, 448, 2260 [NASA ADS] [CrossRef] [Google Scholar]
- Gentile Fusillo, N. P., Tremblay, P.-E., Gänsicke, B. T., et al. 2019, MNRAS, 482, 4570 [NASA ADS] [CrossRef] [Google Scholar]
- Kepler, S. O., Pelisoli, I., Koester, D., et al. 2015, MNRAS, 446, 4078 [NASA ADS] [CrossRef] [Google Scholar]
- Kilic, M., Hambly, N. C., Bergeron, P., Genest-Beaulieu, C., & Rowell, N. 2018, MNRAS, 479, L113 [NASA ADS] [CrossRef] [Google Scholar]
- Kleinman, S. J., Harris, H. C., Eisenstein, D. J., et al. 2004, ApJ, 607, 426 [NASA ADS] [CrossRef] [Google Scholar]
- Kleinman, S. J., Kepler, S. O., Koester, D., et al. 2013, ApJS, 204, 5 [NASA ADS] [CrossRef] [MathSciNet] [Google Scholar]
- Koester, D., & Kepler, S. O. 2015, A&A, 583, A86 [NASA ADS] [CrossRef] [EDP Sciences] [Google Scholar]
- Koester, D., & Knist, S. 2006, A&A, 454, 951 [NASA ADS] [CrossRef] [EDP Sciences] [Google Scholar]
- Lan, T.-W., Ménard, B., Baron, D., et al. 2018, MNRAS, 477, 3520 [NASA ADS] [CrossRef] [Google Scholar]
- Narayan, G., Matheson, T., Saha, A., et al. 2019, ApJS, in press [arXiv:1811.12534] [Google Scholar]
- Rauch, T. 2016, in The Science of Calibration, eds. S. Deustua, S. Allam, D. Tucker, & J. A. Smith, ASP Conf. Ser., 503, 193 [NASA ADS] [Google Scholar]
- Rohrmann, R. D., Althaus, L. G., García-Berro, E., Córsico, A. H., & Miller Bertolami, M. M. 2012, A&A, 546, A119 [NASA ADS] [CrossRef] [EDP Sciences] [Google Scholar]
- Rolland, B., Bergeron, P., & Fontaine, G. 2018, ApJ, 857, 56 [NASA ADS] [CrossRef] [Google Scholar]
- Salaris, M., & Cassisi, S. 2008, A&A, 487, 1075 [NASA ADS] [CrossRef] [EDP Sciences] [Google Scholar]
- Suzuki, N., & Fukugita, M. 2018, AJ, 156, 219 [NASA ADS] [CrossRef] [Google Scholar]
- Tremblay, P.-E., Cukanovaite, E., Gentile Fusillo, N. P., Cunningham, T., & Hollands, M. A. 2019, MNRAS, 482, 5222 [NASA ADS] [CrossRef] [EDP Sciences] [Google Scholar]
- Weidemann, V., & Koester, D. 1995, A&A, 297, 216 [NASA ADS] [Google Scholar]
All Tables
Physical parameters of the 16 stars in the SF18 sample with Gaia DR2 parallax measurements.
All Figures
|
Fig. 1. Color–color diagram for a sample of WD stars from the SDSS DR7 catalog (Kleinman et al. 2013). The SF18 sample is shown with error bars. Lines denote theoretical color-color curves for blackbody (green short-dashed), pure-He (red solid), pure-H (blue long-dashed), and mixed H/He (dotted) atmosphere models as indicated in the figure legend, in the range 14 000–7000 K. Small circles on top of the curves show blackbody, He atmosphere, and H atmosphere models with marks indicating 1000 K intervals. The circles on the bridging between H and He models mark the log(NH/NHe) = −2, −4, −6 values. |
| In the text | |
|
Fig. 2. (FUV − NUV)−(g − r) color–color diagram. Stars in the SF18 sample are shown as black dots with error bars. Lines denote theoretical models as indicated in the legend. Models with H/He mixtures correspond to logg = 8. The H/He models with log(NH/NHe) = −5.4 reproduce all data of stars in the SF18 sample. |
| In the text | |
|
Fig. 3. Emerging monochromatic flux. The orange short dashed line shows a pure-He atmosphere with Teff = 10 000 K, the solid green line a blackbody spectrum with Teff = 10 000 K, the blue long dashed line a pure-He atmosphere with Teff = 9379 K, and the red dotted line a pure-He atmosphere with Teff = 9379 K scaled up by a factor 1.29 to match the total flux of a Teff = 10 000 K spectrum. Model atmospheres correspond to logg = 8. |
| In the text | |
|
Fig. 4. Individual opacity contributions at τRoss = 1 in a cool pure-He WD atmosphere. Dominant contributions are ff processes of He− and |
| In the text | |
|
Fig. 5. Top three panels: absolute difference of colors between blackbody spectrum and pure-He atmospheres (red dotted), log(NH/NHe) = −6 models (solid blue), and best-fit model (dashed orange). Circles denote residuals for the SF18 stars. Fourth panel from top: log(NH/NHe) values for the best-fit model (dashed orange) and log(NH/NHe) = −6 (solid blue, constant). Lower panel: TBB − Teff as a function of blackbody temperature and hydrogen abundance for pure-He, log(NH/NHe) = −6, and best-fit models. |
| In the text | |
|
Fig. 6. Teff and radius of stars in the SF18 sample with measured Gaia parallaxes. Results for different sets of model atmospheres are shown as red circles (logg = 8, He-pure models), blue squares (logg = 9, pure-He models), and black dots with error bars (logg = 8, log(NH/NHe) = −6). Overlaid with long dashed lines are theoretical WD evolutionary tracks for 0.606 M⊙ (CO-core) and 1.16 M⊙ (ONe-core) WD models. Short dashed lines show curves of constant logg determined from evolutionary models. |
| In the text | |
|
Fig. 7. Comparsion of Teff and logg results for the SF18 sample of stars. Blue dots with error bars (this work), open squares (Kleinman et al. 2013), open triangles (Kepler et al. 2015), and open circles (Eisenstein et al. 2006). |
| In the text | |
|
Fig. 8. Comparison of Teff and logg in this work and G19. Differences are shown in the sense (this work − G19). |
| In the text | |
Current usage metrics show cumulative count of Article Views (full-text article views including HTML views, PDF and ePub downloads, according to the available data) and Abstracts Views on Vision4Press platform.
Data correspond to usage on the plateform after 2015. The current usage metrics is available 48-96 hours after online publication and is updated daily on week days.
Initial download of the metrics may take a while.